Everything you need to go from images to results with the most cutting-edge 2D image segmentation, intelligent classification, and comprehensive analytics. Use analysis tools in a free-form manner or choose to standardize your analysis with Protocols.
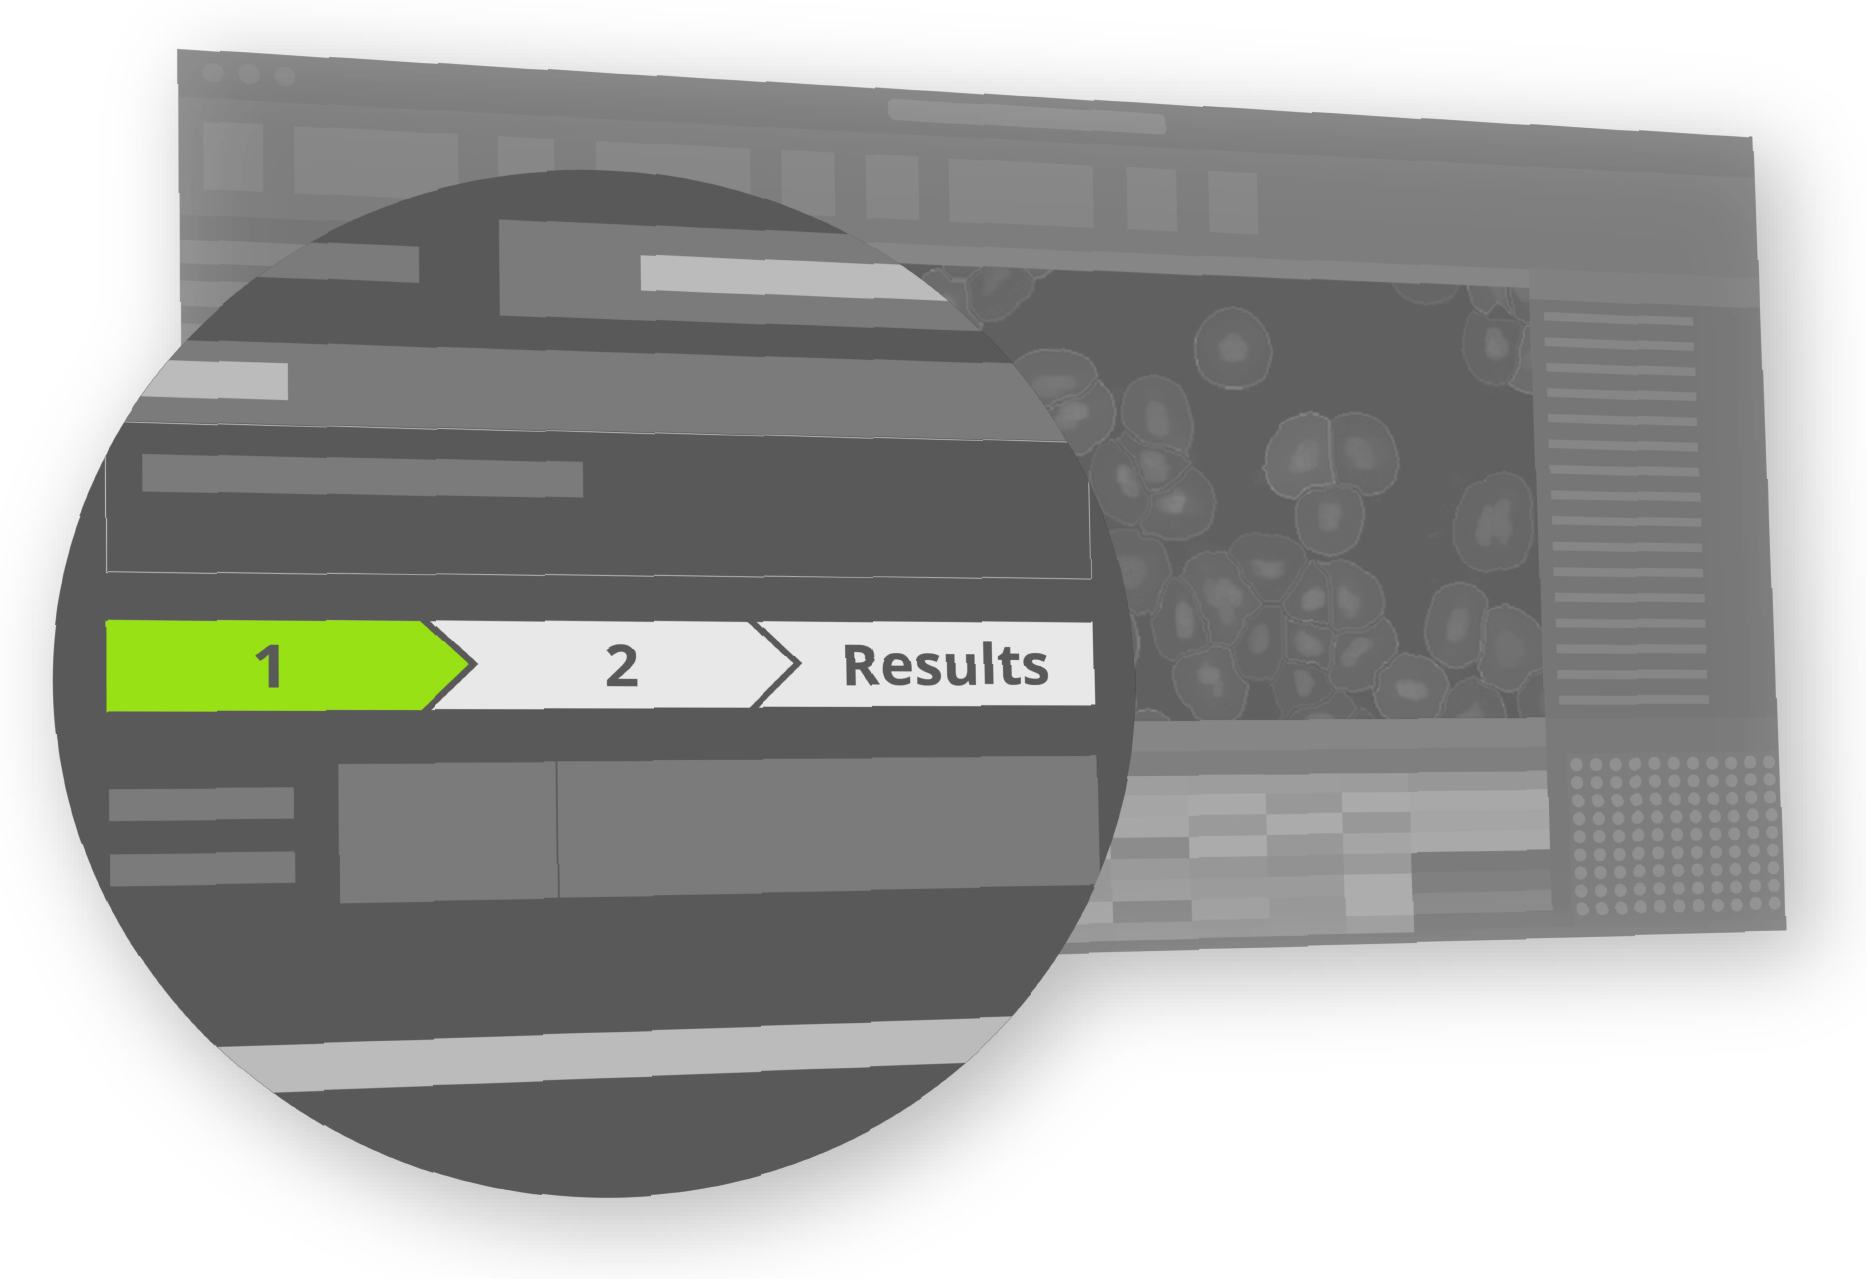
Analysis Protocols
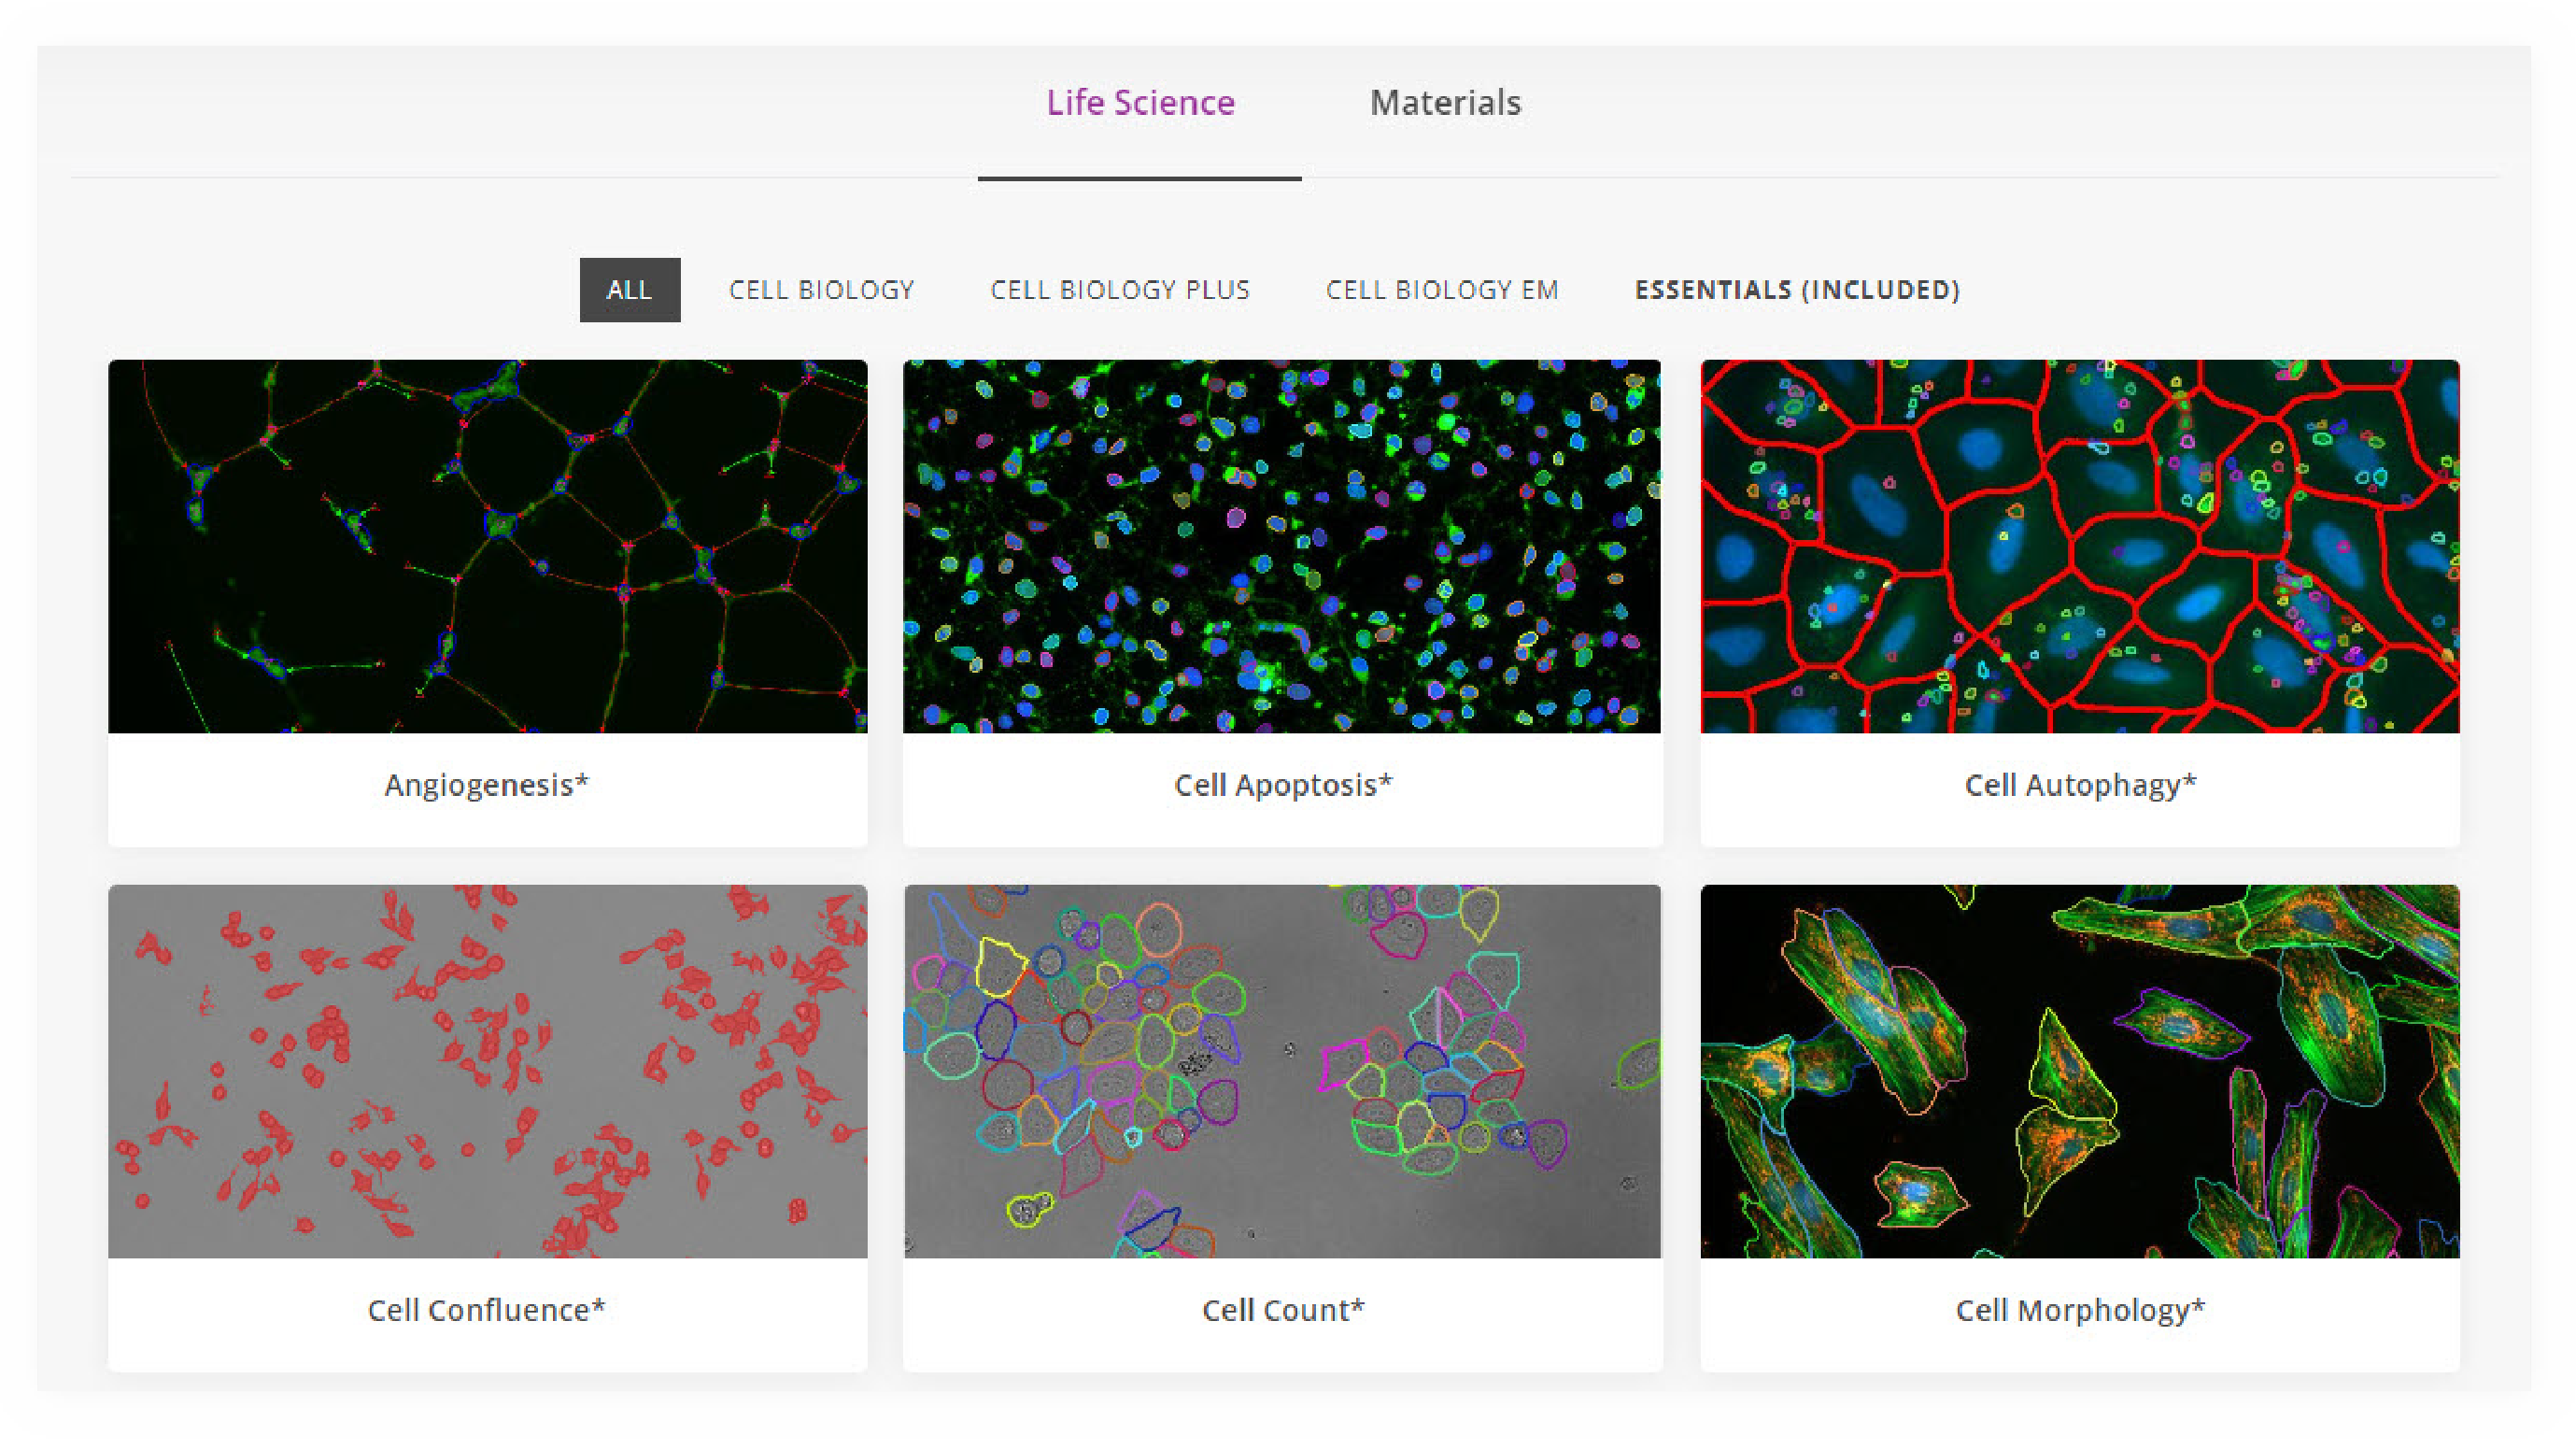
Increase the reliability of your data using a growing library of standardized workflows that feel like they were designed just for you.
Depending on the image, you may need a different segmentation technique. Standard histogram-based, Machine Learning Smart Segmentation, or even AI Deep Learning may be the best option. Image-Pro offers a variety of techniques to choose from - meeting the needs of any challenge.
Machine Learning Smart Segmentation
A capable technique that classifies pixels and builds a recipe based on user input. Simply select the pixels that should be a part of a class and click Count.
A next generation segmentation technology that works similar to how the human brain finds objects, undeterred by by dim or complex edges. Simply load a Pre-Trained model and click Count for fast predictable results.