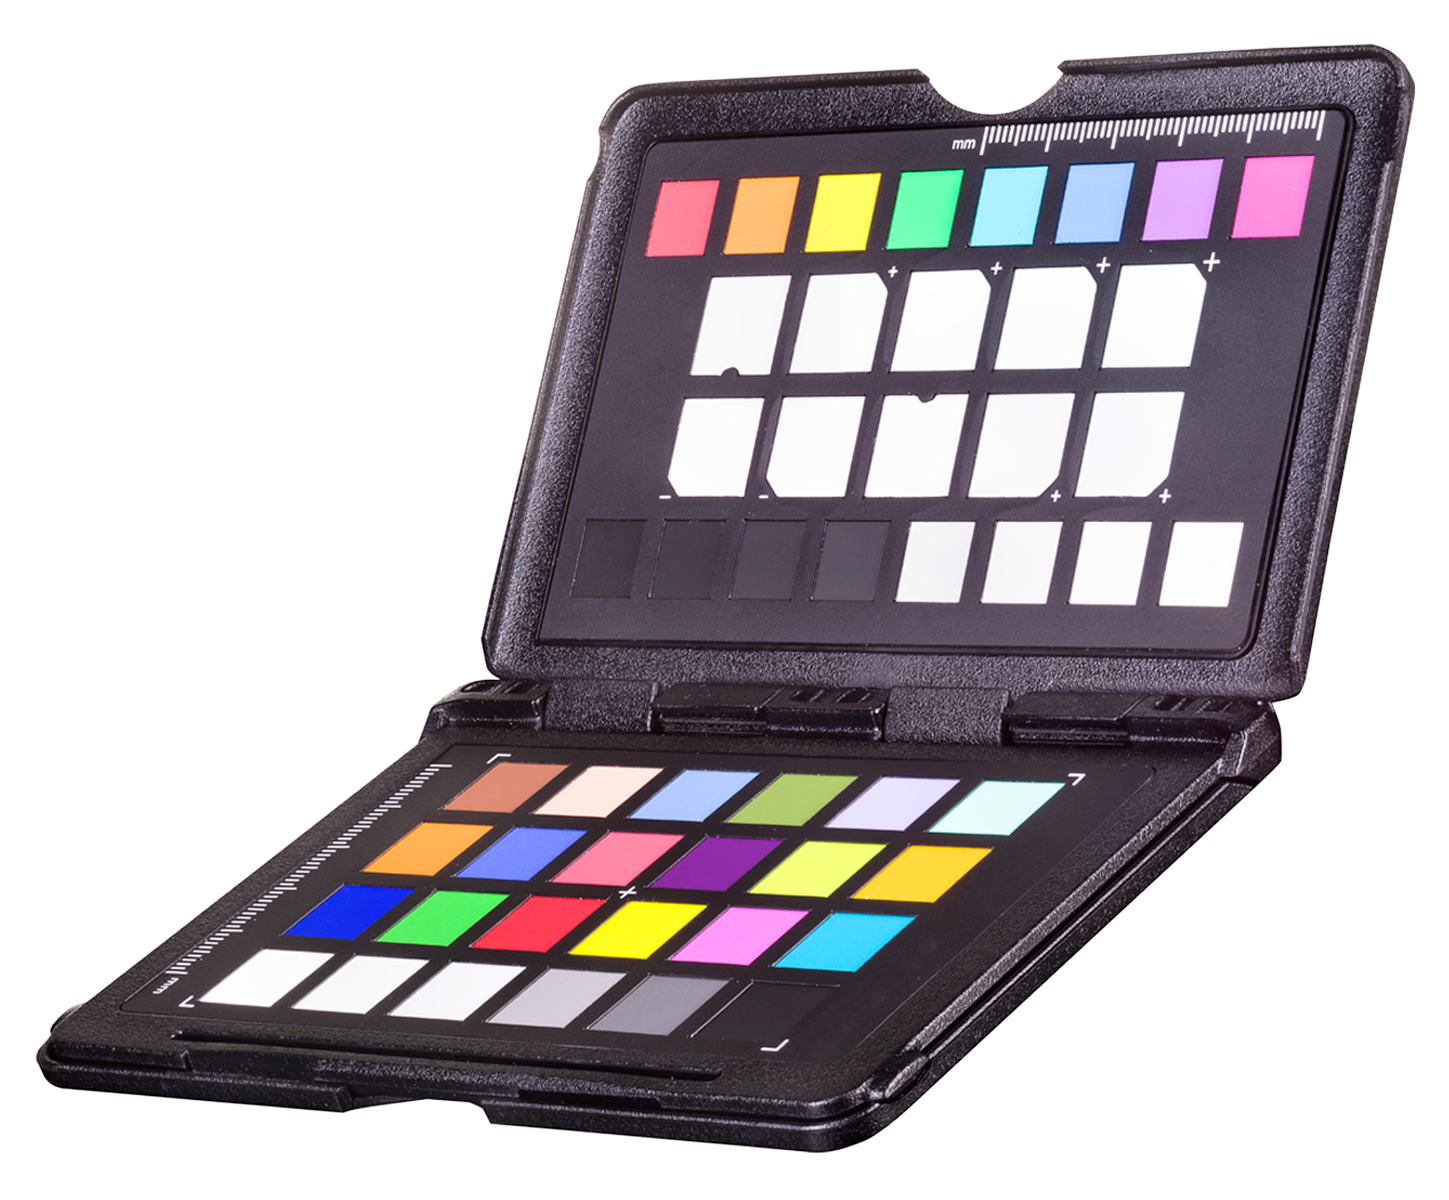
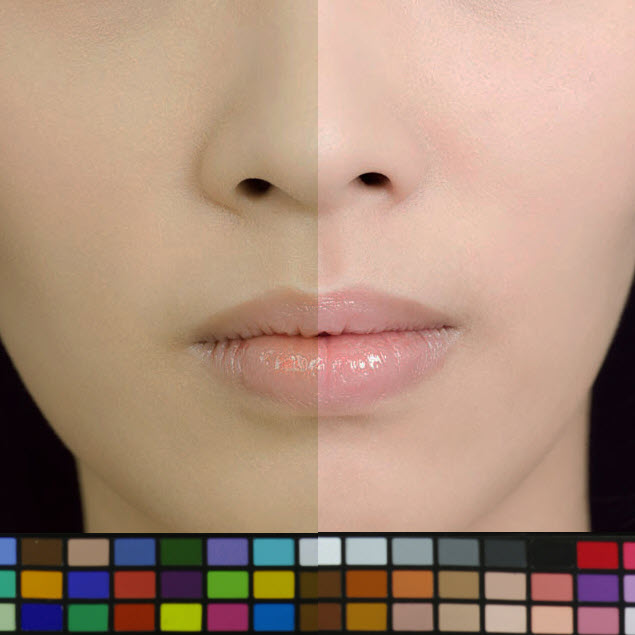
Cosmetics
For measuring material
color accuracy
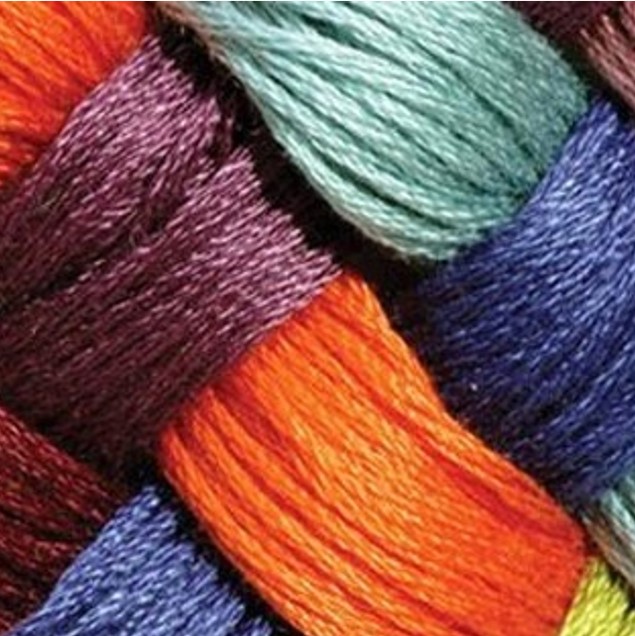
Textile Manufacturing
For comparison to a standard
textile color profile
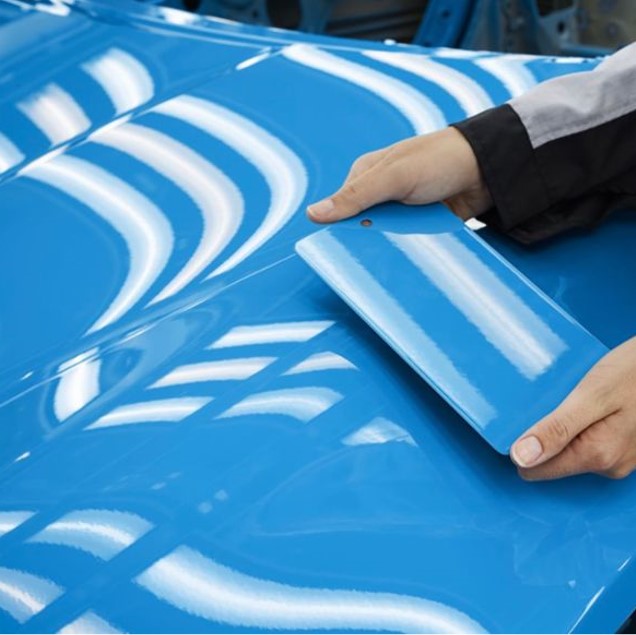
Automotive
For paint color measurement
quality assurance

Pharmaceutical
For ensuring the consistent
color quality of pills & gel caps
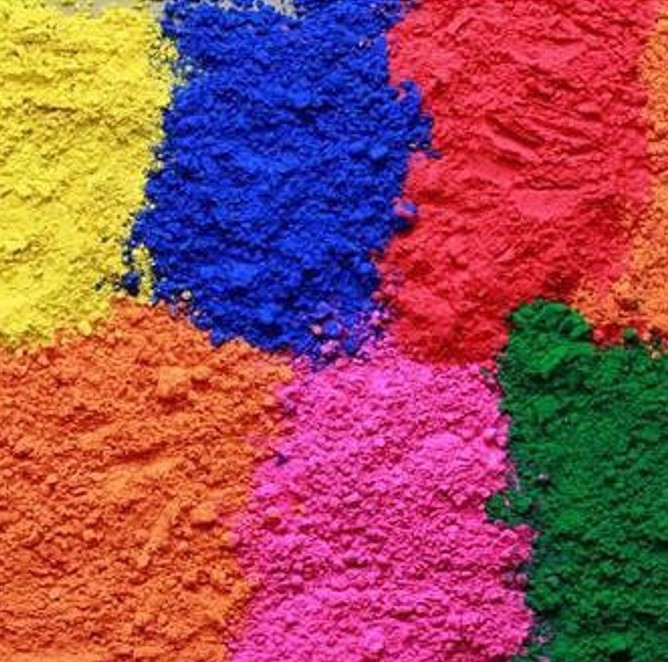
Food Industries
For measuring & comparing
dyes, browning, ripeness, & more
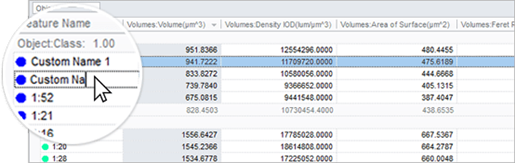
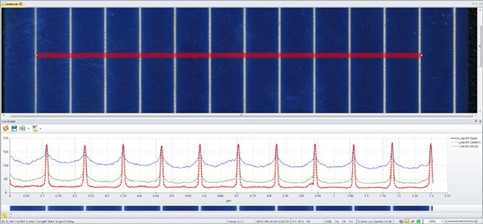
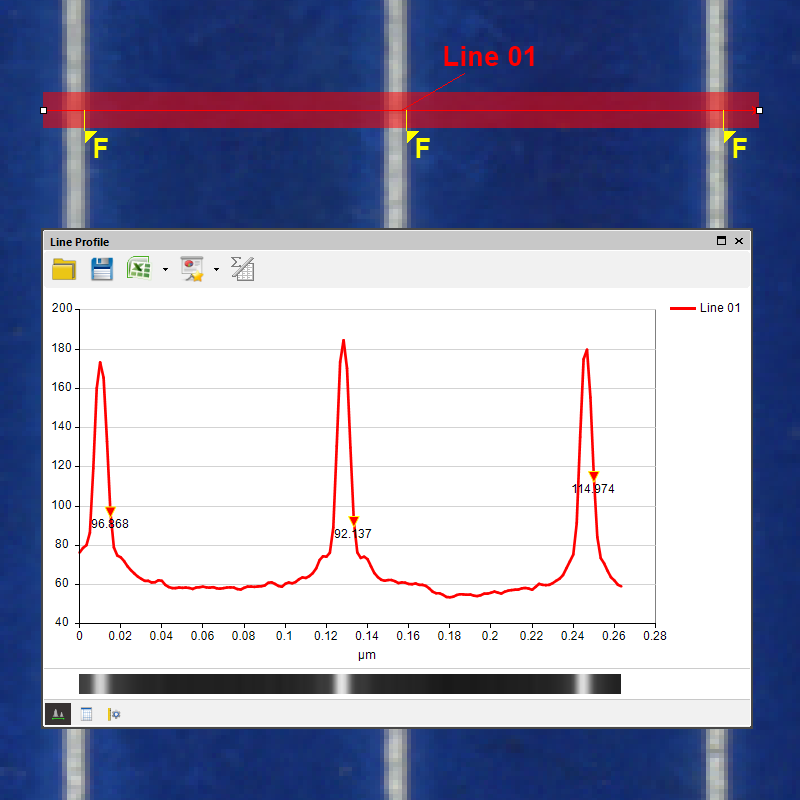
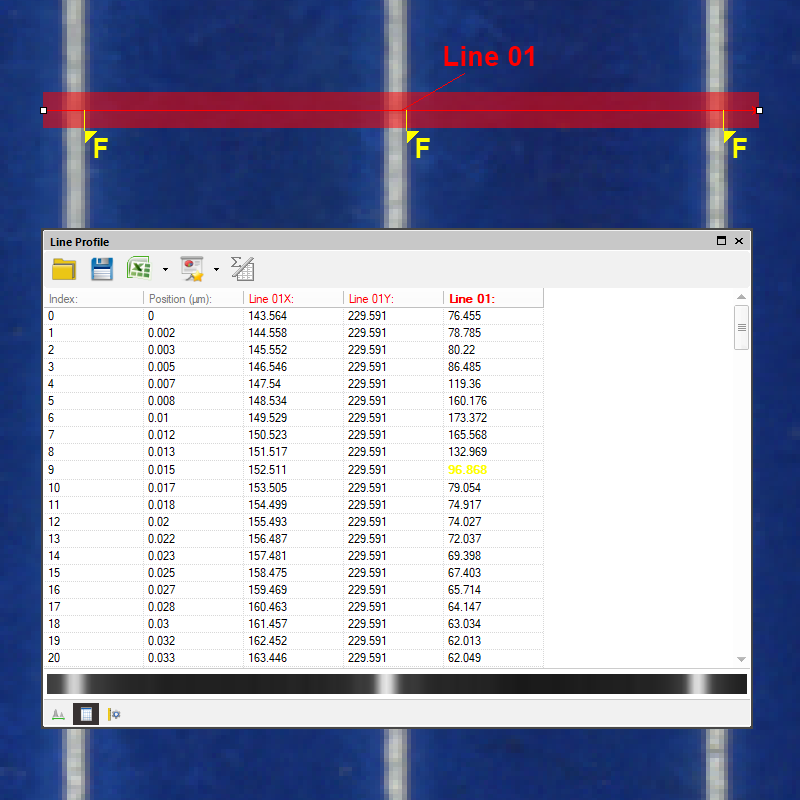
Rename objects by clicking and typing in the table. Also, arrange all objects by color-coded class to see relationships.
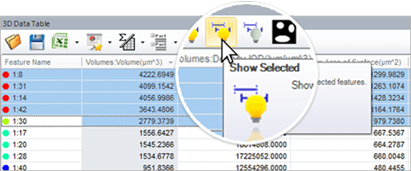
Sort by measurements and adjust tables to only show the relevant data.
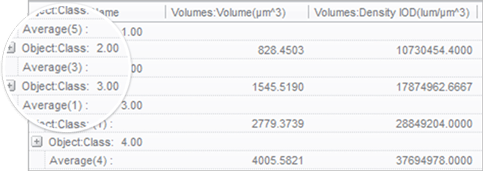
Combine classes of similar objects into a custom hierarchy and see statistics per measurement for each grouped class.