TL;DR — The point spread function (PSF) defines how a microscope blurs light and is essential to deconvolution microscopy. This article explains what a PSF is, how to obtain it (theoretical vs. measured), and why accurate PSF modeling is critical for sharpening images and improving scientific results.
In digital fluorescence microscopy, image sharpness is limited by diffraction. This is where the point spread function (PSF) comes in, a core concept used in deconvolution algorithms to improve image resolution and contrast. In this deep dive, we explore what a PSF is, how it’s obtained, and how its accuracy can make or break your deconvolution results.
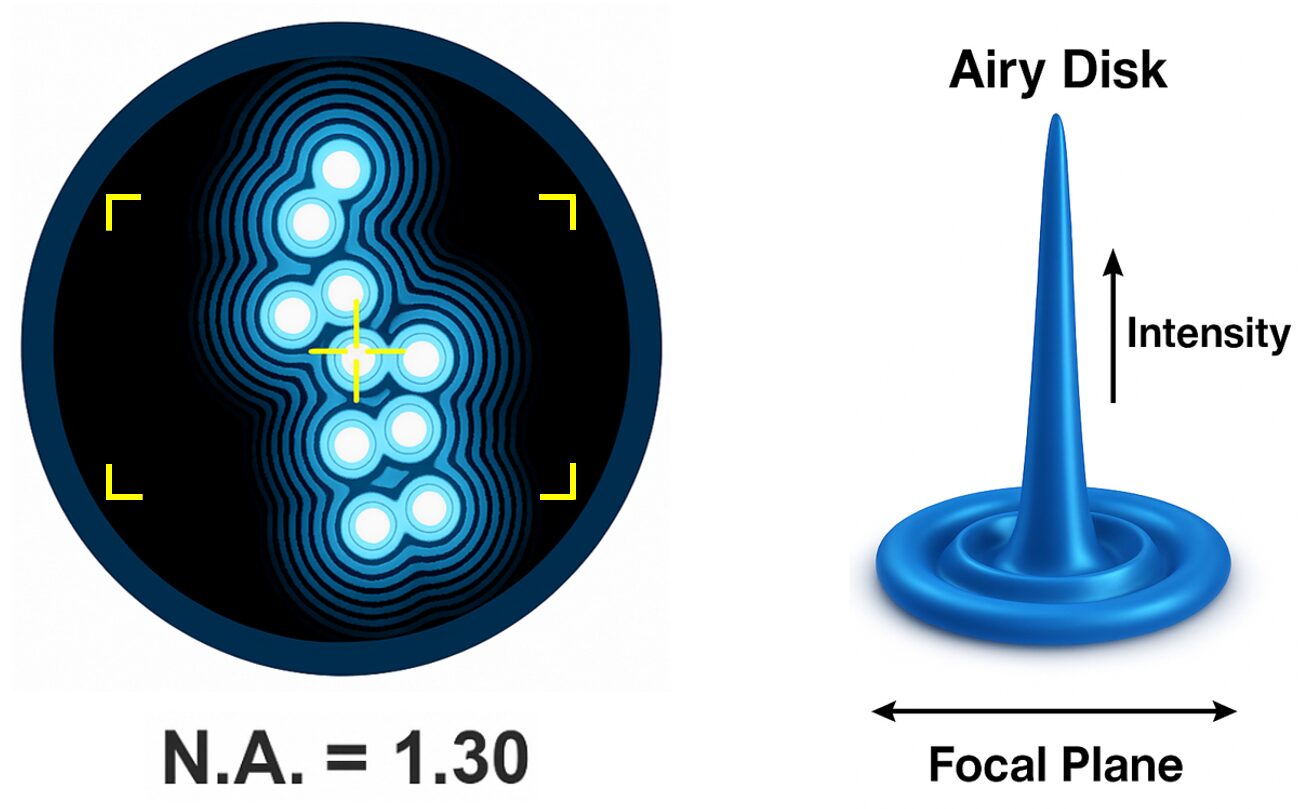
Figure 1. The point spread function (PSF) describes how a microscope blurs individual light sources due to diffraction. Left: overlapping PSFs of closely spaced emitters, illustrating resolution limits set by the numerical aperture (N.A. = 1.30). Right: a 3D representation of an Airy disk, the intensity distribution of light from a single point source in the focal plane. Understanding this pattern is key to deconvolution and image restoration in fluorescence microscopy.
What is the Point Spread Function (PSF) in Microscopy?
Every microscope distorts light to some degree. Even under ideal conditions, a single point of light doesn’t appear as a perfect dot in the image. Instead, it spreads into a characteristic blur pattern called the point spread function (PSF). This pattern is typically shaped like an Airy disk (a bright central spot surrounded by concentric rings) and, in 3D, it resembles an hourglass. As described in a foundational review by Sibarita (2005), the PSF defines how light is redistributed by the microscope’s optics, inherently limiting resolution and contrast.
During image acquisition, each point in the specimen is convolved with the PSF, a process known as convolution. The result is that every structure in the sample becomes blurred by the system's optical fingerprint. What you see in the final image is not a direct map of the specimen, but rather a composite of many overlapping PSFs. Understanding and correcting for this effect is essential to restoring true structural detail through deconvolution.
Definition
The point spread function (PSF) describes how a single point of light appears in a microscope image, showing the system’s inherent optical blur.
Why PSF Accuracy is Critical in Deconvolution
The PSF is essential to deconvolution algorithms because it provides the model for how your microscope blurs light. If the PSF is too narrow, too wide, or distorted in the wrong way, then the deconvolution will reassign light incorrectly.
The result? You might still have blur, or worse, you might see artificial edges or intensity artifacts that weren’t in your original sample. This is especially true in 3D image stacks, where the PSF tends to be anisotropic (not the same in all directions) and particularly blurry in the axial (Z) dimension.
When you're analyzing features like vesicles, nuclei, or structural boundaries, these subtle differences in resolution and intensity can affect your ability to detect, quantify, or segment correctly. These are common frustrations many researchers face during quantitative image analysis, as discussed in The Frustrating Realities of Image Analysis.
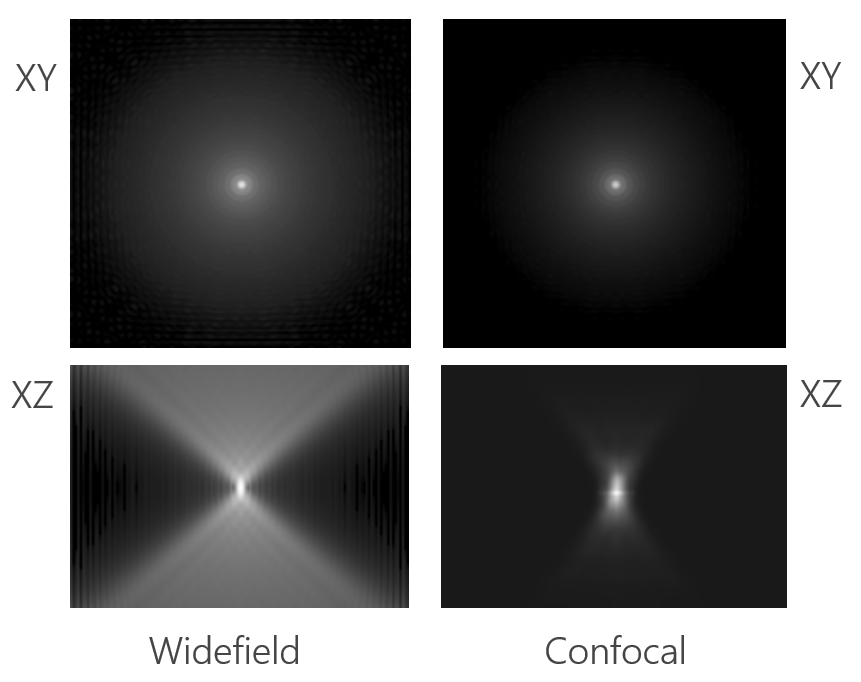
Figure 2. Point spread functions (PSFs) in XY and XZ views for widefield (left) and confocal (right) microscopy. In the XY plane, both modalities show a central Airy disk pattern, but the XZ slices reveal a key difference: the confocal PSF is significantly more compact in Z due to optical sectioning with a pinhole. This results in reduced axial blur and improved depth resolution compared to widefield imaging.
Measured vs. Theoretical PSFs: Pros and Cons
There are two main ways to supply a PSF for deconvolution: measure it from experimental data, or compute it based on microscope parameters.
When to Use a Measured PSF
A measured PSF is obtained by imaging a sub-resolution fluorescent bead (~100–200 nm) under the same optical settings as your sample. This approach captures your system’s real optical performance, including alignment quirks, depth-dependent blur, and aberrations.
Pros
- Captures system-specific aberrations and real optical behavior
- Essential when imaging with modalities that theoretical models don’t support
- Enables highest-accuracy restoration for critical 3D imaging
Cons
- Time-consuming and sensitive to collection errors
- Bead prep must match sample conditions exactly
- Difficult to scale or automate across imaging sessions
When to Use a Theoretical PSF
Theoretical PSFs are generated using optical parameters like numerical aperture, refractive index, emission wavelength, and pixel dimensions. Professional deconvolution tools can compute these automatically or with user input.
Pros
- Fast and reproducible
- Not affected by bead quality or imaging variability
- Often accurate enough for standard widefield and confocal workflows
Cons
- Assumes ideal optics and doesn’t capture real-world aberrations
- Can underperform in deep tissue imaging or misaligned systems
Some software platforms, like Image-Pro’s AutoQuant Deconvolution, help close the gap between theoretical and measured PSFs by allowing users to customize and correct theoretical PSFs. For example, Image-Pro can incorporate spherical aberration adjustments into its PSF generator, based on known mismatches in refractive index or sample depth. This lets users preserve the speed of theoretical PSFs while modeling key distortions, offering a practical middle ground when bead measurement isn’t feasible.
Software tools that simulate aberrations, such as spherical distortion, help bridge the gap between ideal and real-world optics, a principle widely explored in adaptive optics approaches (Booth, 2007).
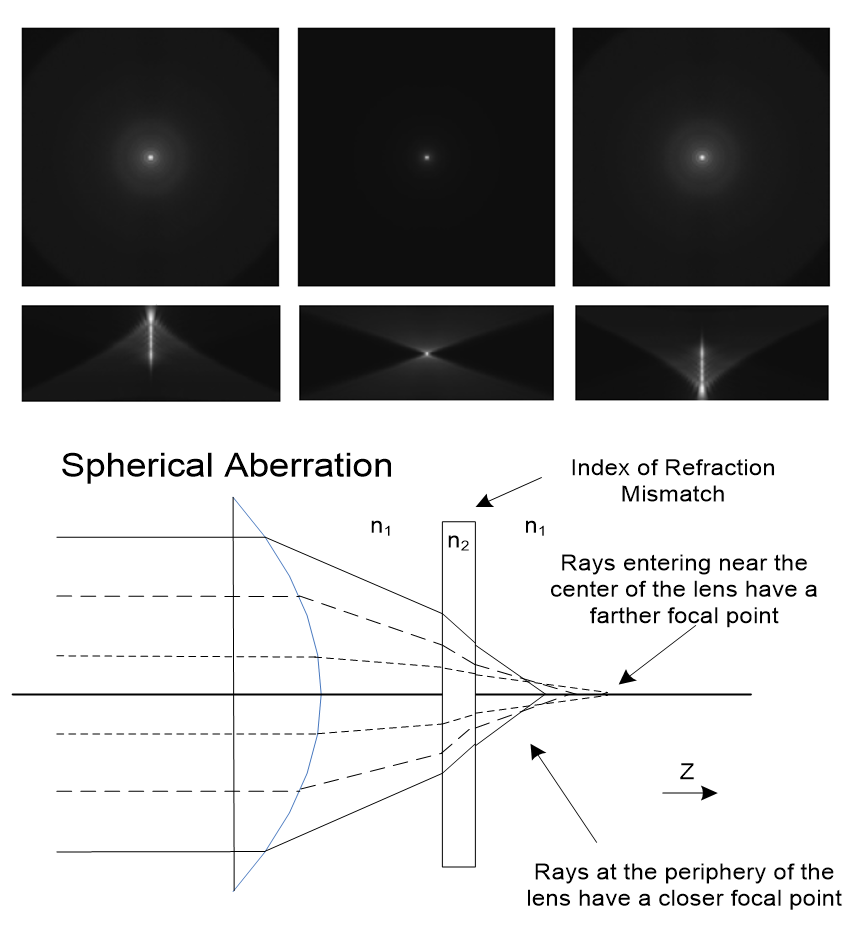
Figure 3. Spherical aberration alters the shape of the point spread function (PSF) in microscopy, especially in the axial (XZ) dimension. The top panels show simulated PSFs with and without aberration: the central image displays an ideal PSF, while the left and right images demonstrate the elongation and asymmetry introduced by refractive index mismatch. The lower diagram illustrates the underlying optical cause, rays passing through the periphery of the lens focus closer than those passing near the center, resulting in image blur and loss of resolution at depth.
Best Practices to Improve Microscopy Image Sharpness with PSFs
One of the most effective ways to improve image sharpness in microscopy is by using a well-matched PSF in your deconvolution workflow.
Regardless of how you obtain your PSF, here are some tips for using it effectively:
- Match your imaging conditions. Make sure the PSF (measured or simulated) uses the same objective NA, imaging modality, wavelength, and imaging depth as your sample.
- Ensure Nyquist sampling. Your image must be sampled finely enough — both laterally and axially — to capture the PSF’s structure. Poor sampling limits what deconvolution can restore.
- Watch for artifacts. Over-iterating a deconvolution can exaggerate features or introduce ringing. Always verify your results with controls.
- Validate your results. Try your workflow on test samples (like beads) to ensure your PSF and parameters give a clean result. The importance of this is highlighted in a famous 2001 article by Wallace et al., where the authors describe images without accurate PSFs as biological structures that may appear sharper, but having lost interpretive reliability, leading to misleading conclusions in quantitative analysis.
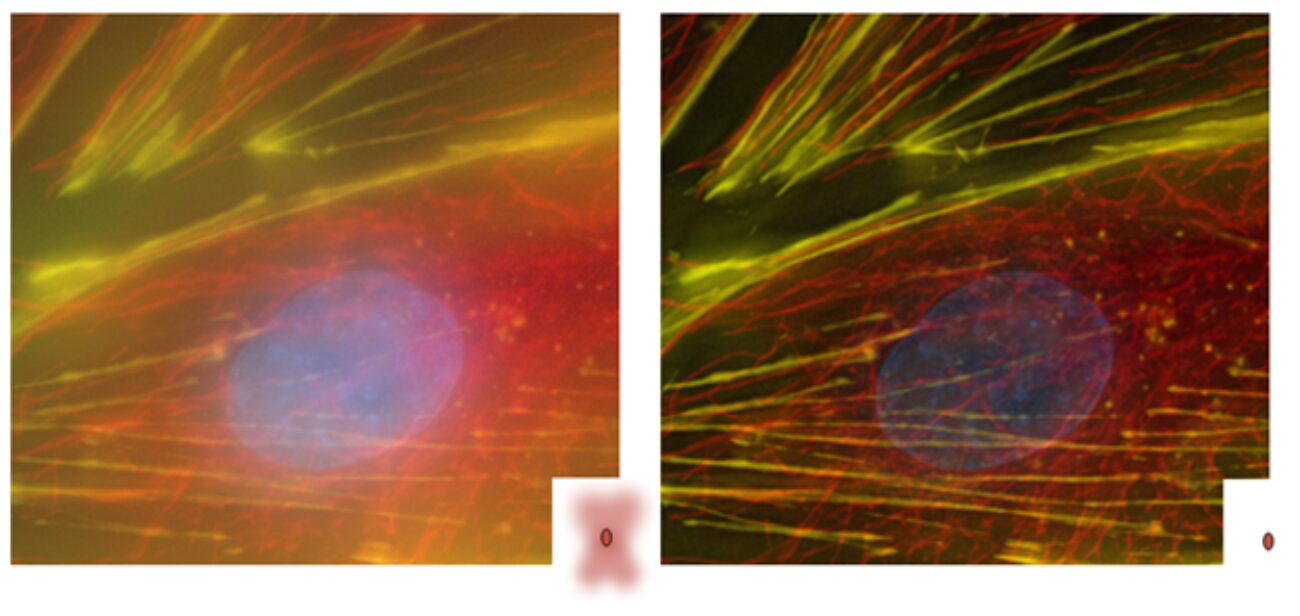
Figure 4. Example of Image-Pro’s AutoQuant Deconvolution applied to a fluorescence microscopy image. The left panel shows the raw widefield image, while the right panel shows the same image after deconvolution. Note the increased resolution, improved contrast, reduced background haze, and clearer structural definition in all dimensions. Image courtesy of Richard Cole, NYS Department of Health, Biggs Laboratory, Wadsworth Center, Albany, NY.
Why This Matters for Imaging Professionals
The accuracy of deconvolution depends heavily on the point spread function (PSF). If the PSF does not reflect how light truly behaves in the microscope, the reconstruction will be unreliable. Model et al. (2011) demonstrated this clearly: spherical aberrations from refractive-index mismatches can bend and blur reconstructions, making structures appear distorted unless proper PSF measurement and aberration correction are applied.
For an intro to the broader image restoration process, check out our Beginner’s Guide to Deconvolution Microscopy.
Regardless of how you obtain your PSF, here are some tips for using it effectively:
- More accurate segmentation
- Better quantification
- Confident colocalization
- Sharper views in thick or low-signal samples
It’s important to use the proper tool that gets you closer to reality, while balancing your time and risk at every imaging session.
Final Takeaways
- The Point Spread Function (PSF) models how your microscope blurs a single point of light, and it’s essential to every deconvolution step.
- You can use a measured PSF (from bead images) or a theoretical PSF (generated from optical settings). Each has trade-offs.
- Tools like Image-Pro’s AutoQuant Deconvolution enhance theoretical PSFs by modeling spherical aberration, offering a practical hybrid between speed and realism.
- Accurate PSFs lead to sharper, more reliable images, and better science.
- If you care about image quality and quantification, taking PSF selection seriously is one of the best ways to level up your microscopy workflow.
Frequently Asked Questions
No. Your PSF must match your exact optical setup. Changes in objective lens, zoom, or even immersion medium affect the PSF and should be accounted for.
You should measure a new PSF any time your microscope configuration changes significantly, such as after service, alignment, or switching objectives. For consistency, some users refresh their PSF weekly or monthly.
This usually means the PSF is poorly matched, or the algorithm settings are too aggressive. Try using fewer iterations or refining the PSF source.
Yes. The PSF depends on wavelength, so each fluorophore should have a separate PSF, or at least a wavelength-adjusted version.
It’s not recommended. Even small differences in optics, alignment, or objective lens can produce a different PSF. Always match the PSF to the system it will be used with.
For researchers who need accurate and reproducible image restoration, Image-Pro (with AutoQuant Deconvolution) is a powerful solution. It combines advanced algorithms with intuitive tools to handle both 2D and 3D datasets and supports measured or theoretical PSFs, including options to simulate spherical aberration. With batch processing, iterative control, and visualization tools built in, it’s designed to support high-quality quantitative microscopy workflows from start to finish.


Media Cybernetics
sales@mediacy.com
Related Links