TL;DR — To acquire images suitable for deconvolution microscopy, use Nyquist-appropriate sampling in XY and Z, ensure adequate signal-to-noise ratio without saturation, match optical conditions to the PSF exactly, and capture padding planes above and below the specimen. These steps preserve spatial information required for accurate restoration in both widefield and confocal fluorescence microscopy.
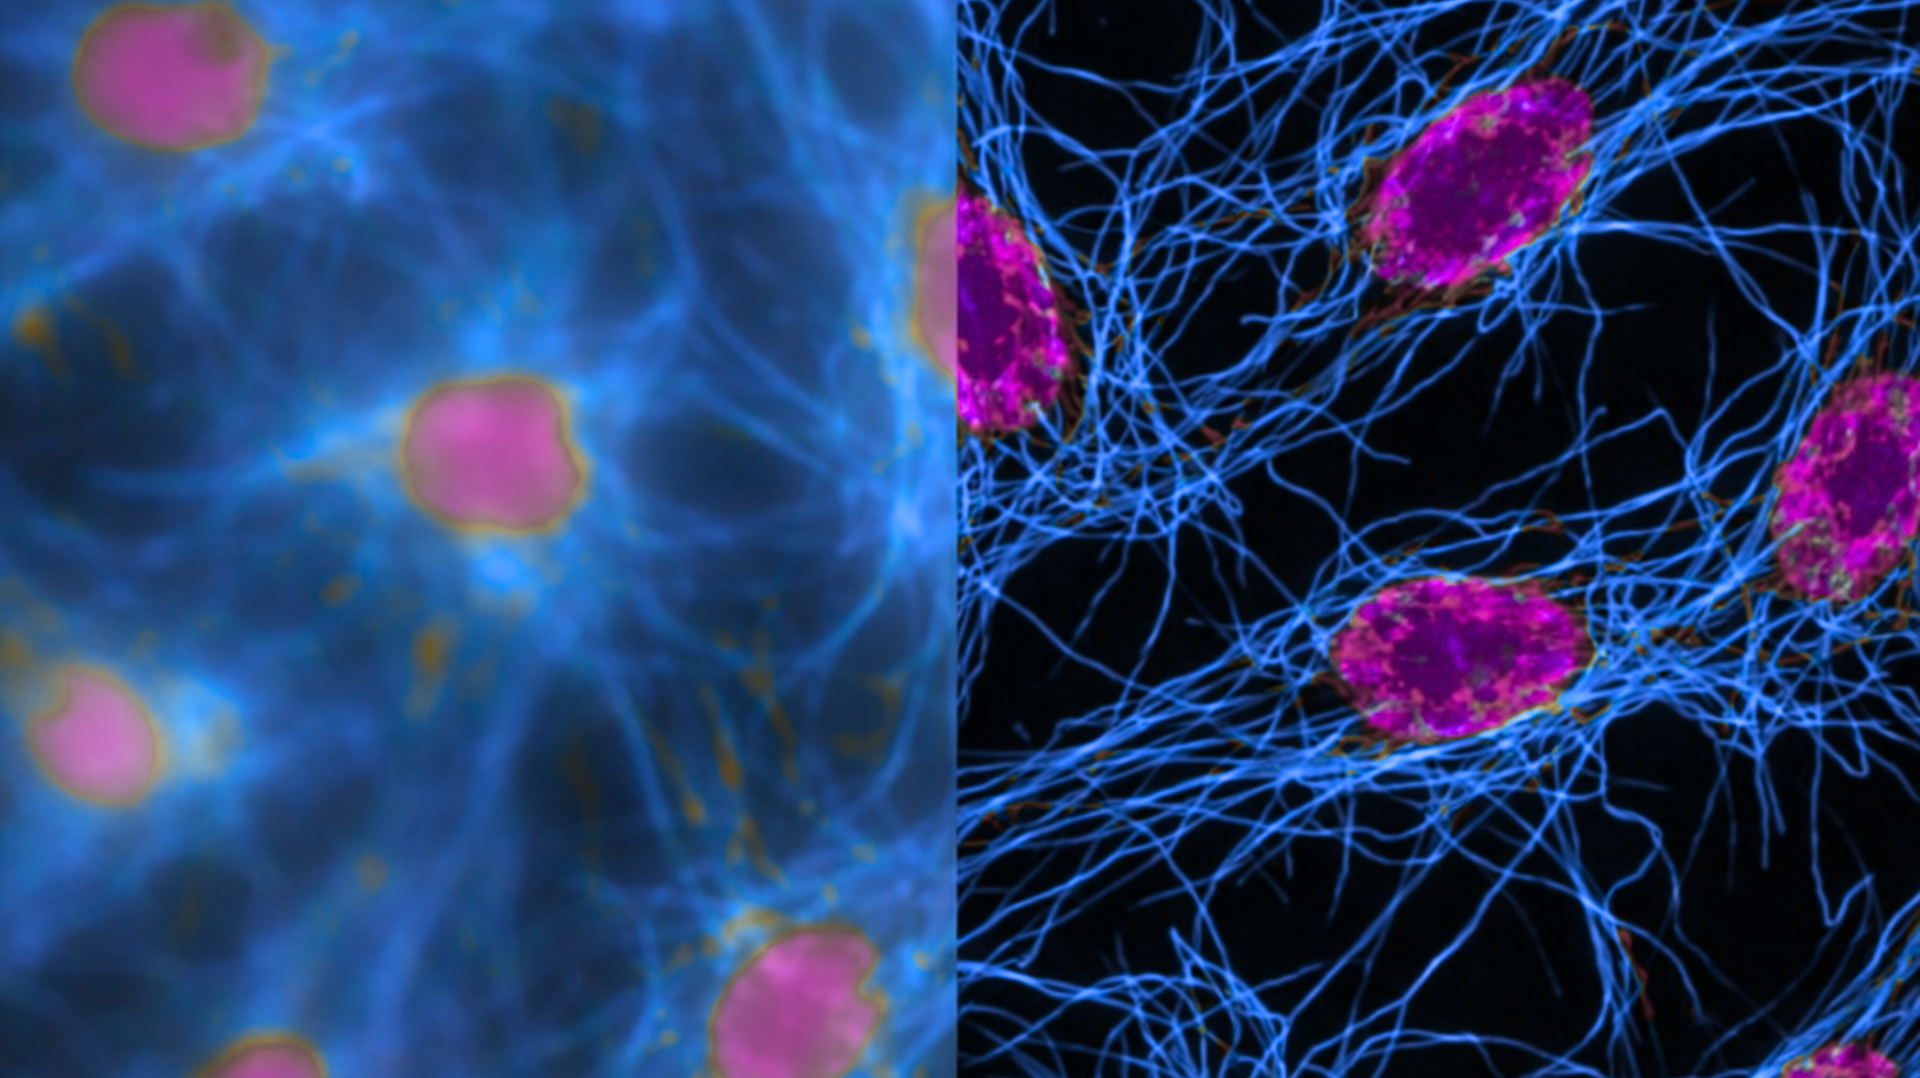
Figure 1. Raw widefield fluorescence image (left side) compared to the same dataset after iterative deconvolution (right side). Deconvolution restores contrast and resolution by computationally reversing optical blur using the microscope’s point spread function (PSF), revealing fine structures that were obscured in the original acquisition.
Why Acquisition Determines Deconvolution Success
Deconvolution improves image clarity by reversing optical blur using a model of how light spreads through the microscope, known as the Point Spread Function (PSF).
If you haven’t already, see Beginner’s Guide to Deconvolution Microscopy and Understanding the Point Spread Function in Deconvolution for foundational concepts.
The key idea: deconvolution cannot recover information that was never captured.
Proper image acquisition for deconvolution microscopy, including Nyquist sampling, pixel size selection, and exact optical matching is essential for both widefield and confocal fluorescence imaging.
Widefield vs. Confocal: Why Both Benefit from Deconvolution
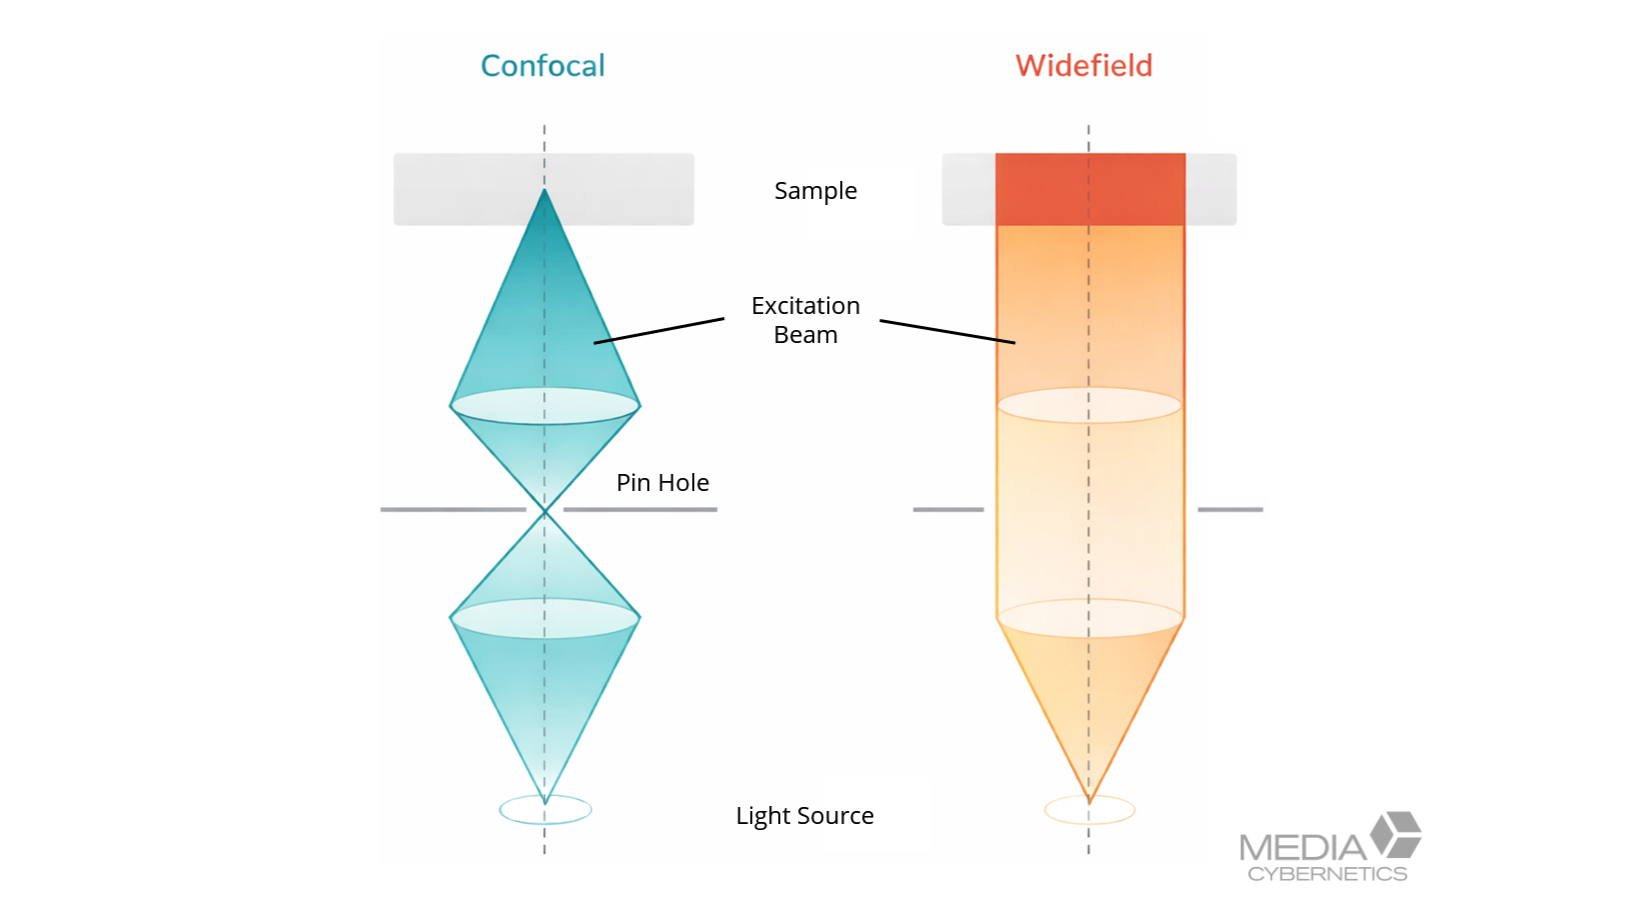
Figure 2. Comparison of widefield and confocal fluorescence imaging before deconvolution. Widefield captures signal from the full specimen depth, producing out-of-focus blur, while confocal microscopy uses a pinhole to reject background light. Both modalities benefit from deconvolution to improve resolution, contrast, and quantitative accuracy.
Widefield Microscopy
Widefield systems collect fluorescence from the entire depth of the specimen at once, producing significant out-of-focus blur. Deconvolution computationally reassociates this light with its origin, dramatically improving contrast and axial resolution.
Classic studies such as (Carrington et al., 1995; Wallace et al., 2001) demonstrated that iterative deconvolution can dramatically improve widefield fluorescence images and recover axial detail that can approach confocal-like sectioning under favorable conditions.
Confocal Microscopy
Confocal microscopes physically reject out-of-focus light using a pinhole, producing optical sections. However, confocal images still suffer from:
- Diffraction-limited blur
- Noise amplification at small pinhole sizes
- Reduced signal at depth
Deconvolution can:
- Improve lateral and axial resolution
- Increase contrast
- Restore signal lost to small pinholes
- Improve quantitative accuracy
Studies have shown deconvolution enhances confocal images beyond raw optical sectioning (McNally et al., 1999; Shaw, 2006).
In practice:
Widefield + deconvolution → dramatic improvement
Confocal + deconvolution → refinement and resolution boost
Tip 1 — Determine Nyquist Sampling Requirements (XY and Z)
Deconvolution can only recover detail that was properly sampled during acquisition. To capture the full resolving power of the microscope, images should be acquired near the Nyquist rate, meaning measurements are taken frequently enough to preserve the smallest resolvable features (a principle described in classic microscopy references such as Pawley’s Handbook of Biological Confocal Microscopy.
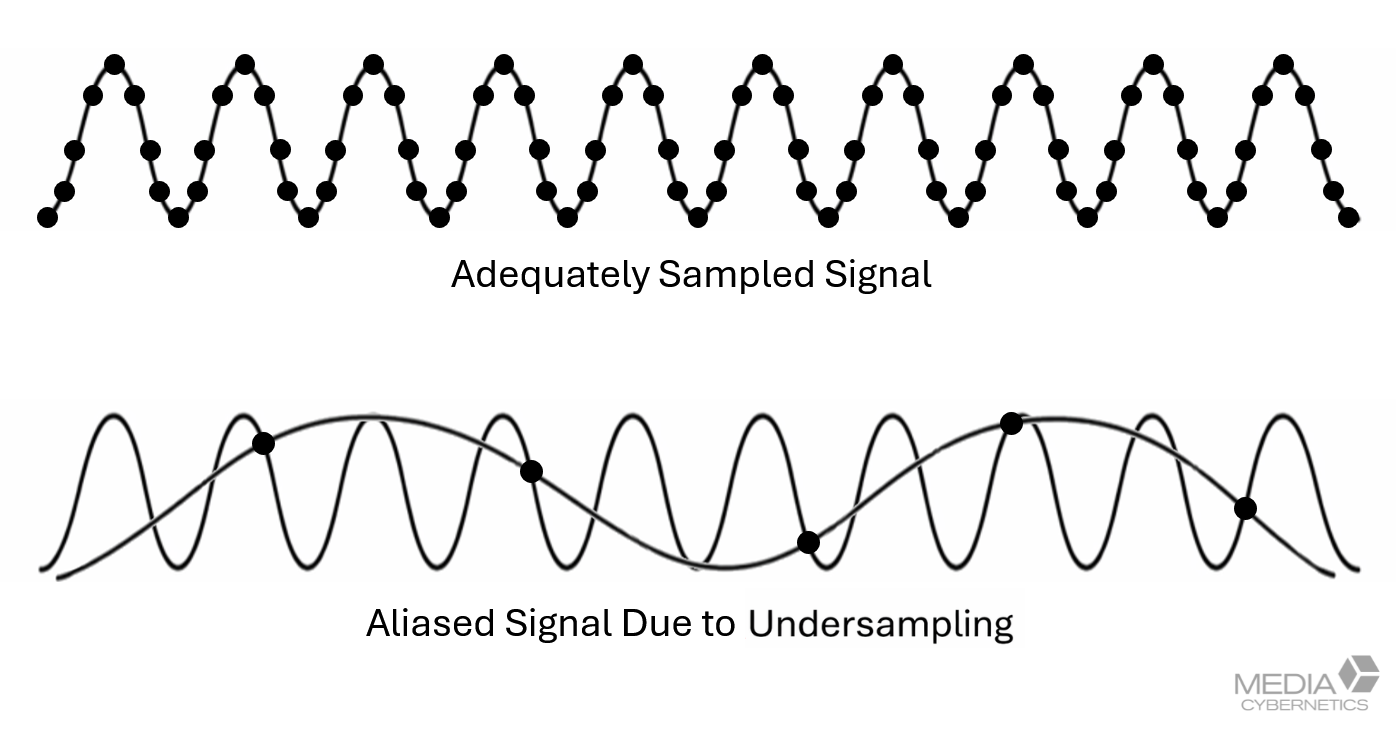
Figure 3. Illustration of Nyquist-appropriate sampling in XY and Z for fluorescence microscopy. Pixels and optical sections must be spaced closely enough to capture the microscope’s full resolving power. Under sampling permanently loses spatial information that cannot be recovered by deconvolution.
This applies to all three dimensions:
XY (lateral): Pixels must be small enough to capture fine detail across the image — typically about 0.06-0.12 µm at the specimen for high-NA fluorescence imaging.
Z (axial): Optical sections must be close enough together to capture detail in depth — often around 0.2–0.5 µm, depending on wavelength and NA.
If sampling is too coarse in any dimension, information is permanently lost and cannot be restored by deconvolution. Proper Nyquist sampling is essential for both widefield and confocal microscopy, ensuring restoration algorithms have sufficient information to improve contrast, resolution, and quantitative accuracy.
Quick Nyquist Calculator:
XY pixel size (µm)
≈ 0.3 × λ / NA
Z step (µm)
≈ n × λ / NA²
λ (lambda) — Fluorescence emission wavelength in micrometers (µm), not nanometers
NA — Numerical Aperture of the objective lens
(Example: 0.75, 1.20, 1.40)
n — Refractive index of the immersion medium
Air ≈ 1.00, Water ≈ 1.33, Oil ≈ 1.518
Table 1. Typical Nyquist sampling recommendations for common objective numerical apertures in fluorescence microscopy.
Tip 2 — Optimize Pixel Size at the Specimen
Meeting Nyquist sampling in XY depends on the effective pixel size at the specimen, determined by the camera and total magnification — not the objective alone.
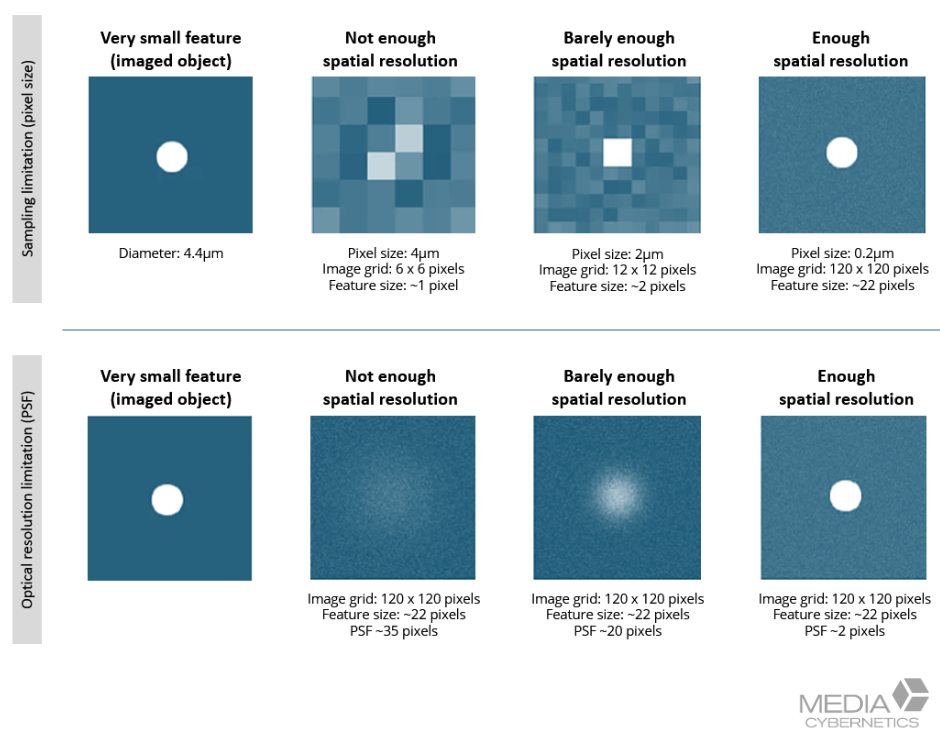
Figure 4. Effective pixel size depends on camera pixel size and total magnification. Matching detector sampling to the optical resolution ensures fine details are captured at the specimen plane, providing the information required for accurate deconvolution restoration.
Effective pixel size is:
Camera pixel size ÷ total magnification
For example, a 6.5 µm camera pixel yields ~0.108 µm at 60X and ~0.065 µm at 100X. If this value is larger than the Nyquist target from Tip 1, the image will be under sampled even if the optics can resolve more detail. Oversampling is generally safer than under sampling, though it increases acquisition time, data size, and potential photobleaching.
Tip 3 — Preserve Linearity (Avoid Saturation)
Quantitative deconvolution requires accurate intensity relationships.
Capture:
- Raw, linear data
- No clipping
- No gamma correction
- Consistent exposure across Z
Studies of quantitative deconvolution microscopy, including the widely cited work by McNally et al., 1999 emphasize the importance of preserving linear intensity relationships during acquisition.
Tip 4 — Maximize Signal-to-Noise Ratio
Noise limits deconvolution effectiveness.
Strategies:
- Use adequate exposure rather than excessive gain
- Minimize background fluorescence
- Use appropriate filters and clean optics
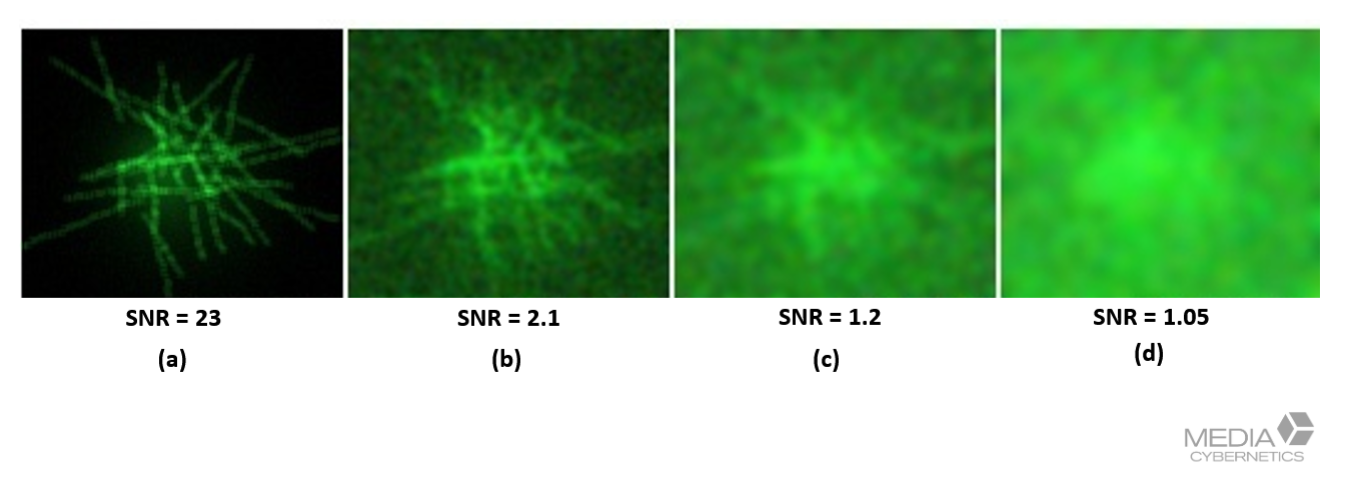
Figure 5. High signal-to-noise ratio (SNR) improves deconvolution performance. Adequate exposure and clean optics preserve meaningful signal while minimizing noise, allowing restoration algorithms to enhance real structures rather than amplify artifacts.
For confocal systems:
- Avoid overly small pinholes that sacrifice signal
- Apply averaging to improve SNR, ensuring photobleaching does not compromise the sample
Tip 5 — Capture Extra Planes Beyond the Specimen
Include padding above and below the region of interest.
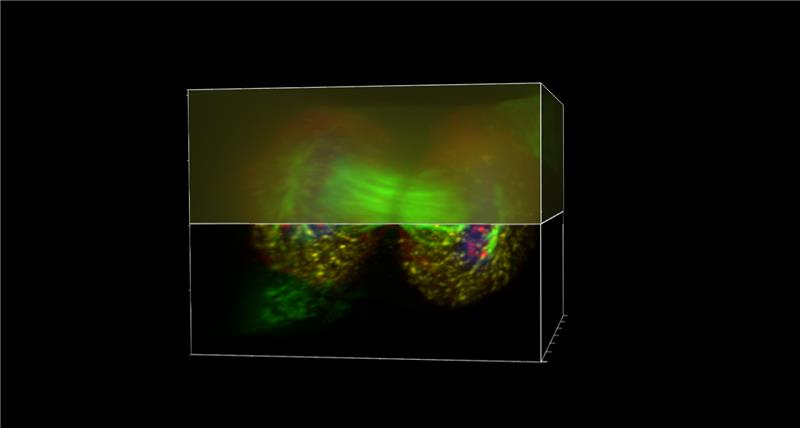
Figure 6. Acquiring additional planes above and below the specimen prevents edge artifacts. Padding ensures that out-of-focus light contributions are properly modeled during deconvolution, improving accuracy throughout the reconstructed volume.
This prevents edge artifacts and allows proper modeling of out-of-focus light contributions.
Tip 6 — Match Optical Conditions to the PSF
Applies to both widefield and confocal stacks.
For best deconvolution results, try to image under conditions that exactly match those assumed by the PSF. The way light spreads in a microscope (and therefore the PSF used for restoration) depends on several optical factors, including:
Numerical aperture (NA) of the objective
Fluorescence wavelength
Refractive index of the immersion medium and sample
Imaging depth within the specimen
In practice, the most common source of mismatch is refractive index differences between the immersion medium, coverslip, and sample. These mismatches introduce spherical aberration that worsens with imaging depth, distorting the PSF and reducing resolution.
Before acquisition, check the basic optical setup:
- Use the coverslip thickness specified for the objective (often #1.5H)
- Choose an immersion medium appropriate for the sample (oil, water, or glycerol)
- Adjust the objective’s correction collar when imaging through thicker samples
- Image as close to the coverslip as practical when possible
If structures appear sharp near the coverslip but progressively blur with depth, optical mismatch is likely limiting your results. Addressing these factors improves both the raw data and the accuracy of the PSF used for deconvolution. Refractive index mismatch effects on resolution and aberration are well documented in confocal microscopy studies such as Hell et al (1993).
Tip 7 — Use an Accurate PSF
As discussed in the article, What Is a Point Spread Function (PSF) in Microscopy? Understanding Its Role in Deconvolution, the PSF defines deconvolution accuracy.
Measured PSF: Acquire bead images under the same conditions as the sample.
Theoretical PSF: Useful when measurement is not practical, but less accurate for thick or mismatched specimens.
Tip 8 — When to Compromise on Sampling
While Nyquist sampling provides the best conditions for deconvolution, real experiments often require compromises. Finer sampling improves restoration but increases acquisition time, photobleaching, and susceptibility to drift.
Consider relaxing sampling slightly when imaging:
- Live or sensitive specimens
- Long time-lapse experiments
- Large volumes where acquisition speed is critical
Oversampling beyond Nyquist offers diminishing returns, whereas moderate under sampling may be acceptable when signal preservation or temporal resolution is more important than maximum spatial resolution.
Acquisition Checklist for Deconvolution Microscopy-Ready Data
Nyquist-appropriate pixel size and Z-step
No saturation or nonlinear processing
High signal-to-noise ratio
Padding above and below specimen
Match optical conditions to the PSF exactly
Accurate PSF parameters
Final Thoughts
Deconvolution is most powerful when acquisition is optimized.
In widefield microscopy, it can transform blurred volumes into sharp, sectioned images.
In confocal microscopy, it refines resolution and improves quantitative accuracy.
The most successful workflows treat acquisition and deconvolution as a single integrated process, not separate steps.
If the accuracy of your results matters, it starts at the microscope.
Frequently Asked Questions
To acquire images suitable for deconvolution microscopy, sample at or near the Nyquist rate in XY and Z, avoid saturation to preserve linear intensity data, maximize signal-to-noise ratio, capture padding planes above and below the specimen, and match optical conditions to the PSF exactly. These steps ensure that sufficient spatial information is captured for accurate restoration in both widefield and confocal fluorescence microscopy.
The optimal Z-step depends on numerical aperture, wavelength, and refractive index, but for high-resolution fluorescence imaging it is typically around 0.2–0.5 µm for high-NA objectives. Sampling near the Nyquist rate ensures that axial detail is preserved and prevents artifacts during deconvolution.
The effective pixel size at the specimen should be small enough to capture the microscope’s lateral resolution, typically around 0.06–0.12 µm for high-NA fluorescence imaging. Pixel size depends on camera pixel pitch and total magnification, not the objective alone.
Yes. While confocal microscopy provides optical sectioning, confocal images still contain diffraction blur and noise. Deconvolution can further improve contrast, resolution, and quantitative accuracy, particularly in deeper regions of the specimen.
Under sampling causes loss of fine detail and can introduce artifacts during deconvolution. Once spatial information is lost during acquisition, it cannot be recovered computationally.
Oversampling is generally safer than under sampling because it preserves spatial information, but it increases acquisition time, photobleaching risk, and data size. Sampling slightly beyond Nyquist provides diminishing returns.
Deconvolution algorithms cannot recover spatial information that was not captured during acquisition. Nyquist sampling ensures that pixels and Z-steps are close enough together to preserve the microscope’s full resolving power, enabling accurate restoration.

![Practical Image Analysis using AI and Image-Pro [WEBINAR]](https://mediacy.com/wp-content/uploads/2026/02/Copy-of-092025-Klein-x-Asia-Imaging-Webinar-Blog-3-1140x740.png)
Media Cybernetics
sales@mediacy.com
Related Links