- Products
- Features
- App Center
- Resources
Self-Service Support
Live Support & Services
- Company
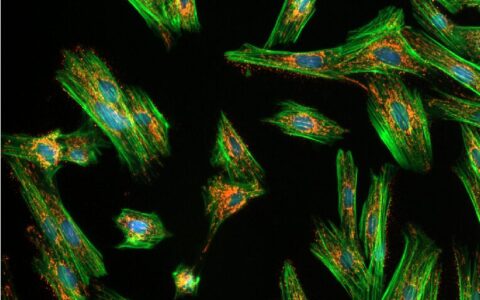
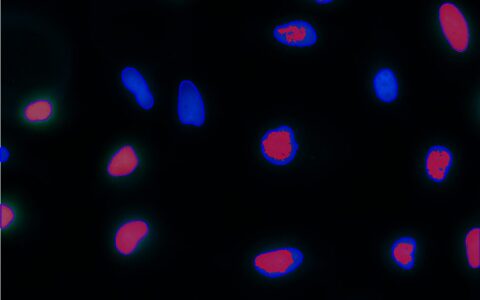
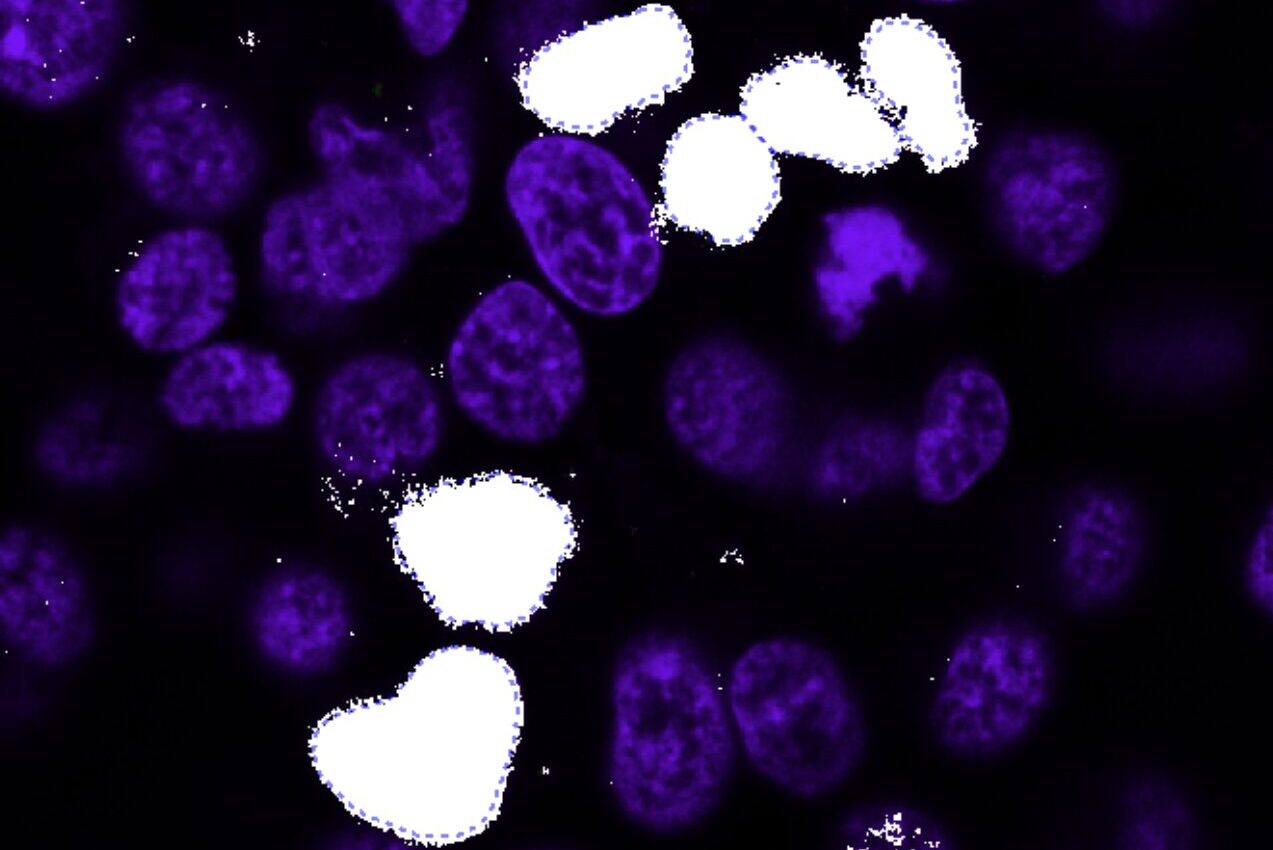
A common question among cell biologists is whether a pair of fluorescently labeled proteins interact with one another. This can often be deduced by examining micrographs—if the proteins are localized in the same areas, there is a chance they interact. If their intensity distributions correlate, with both becoming brighter or darker in the same regions, the likelihood of interaction is increased.
The Image-Pro Colocalization protocol calculates Pearson's Correlation Coefficient (PCC) between two fluorescence channels, quantifying the degree of overlap between them. It also calculates the proportion of intensities in each channel to which the PCC applies and summarizes the results in an easy-to-understand sentence. This protocol allows for the analysis of large datasets in formats like multi-well plates, requiring little to no image analysis experience.
Techniques: Fluorescence
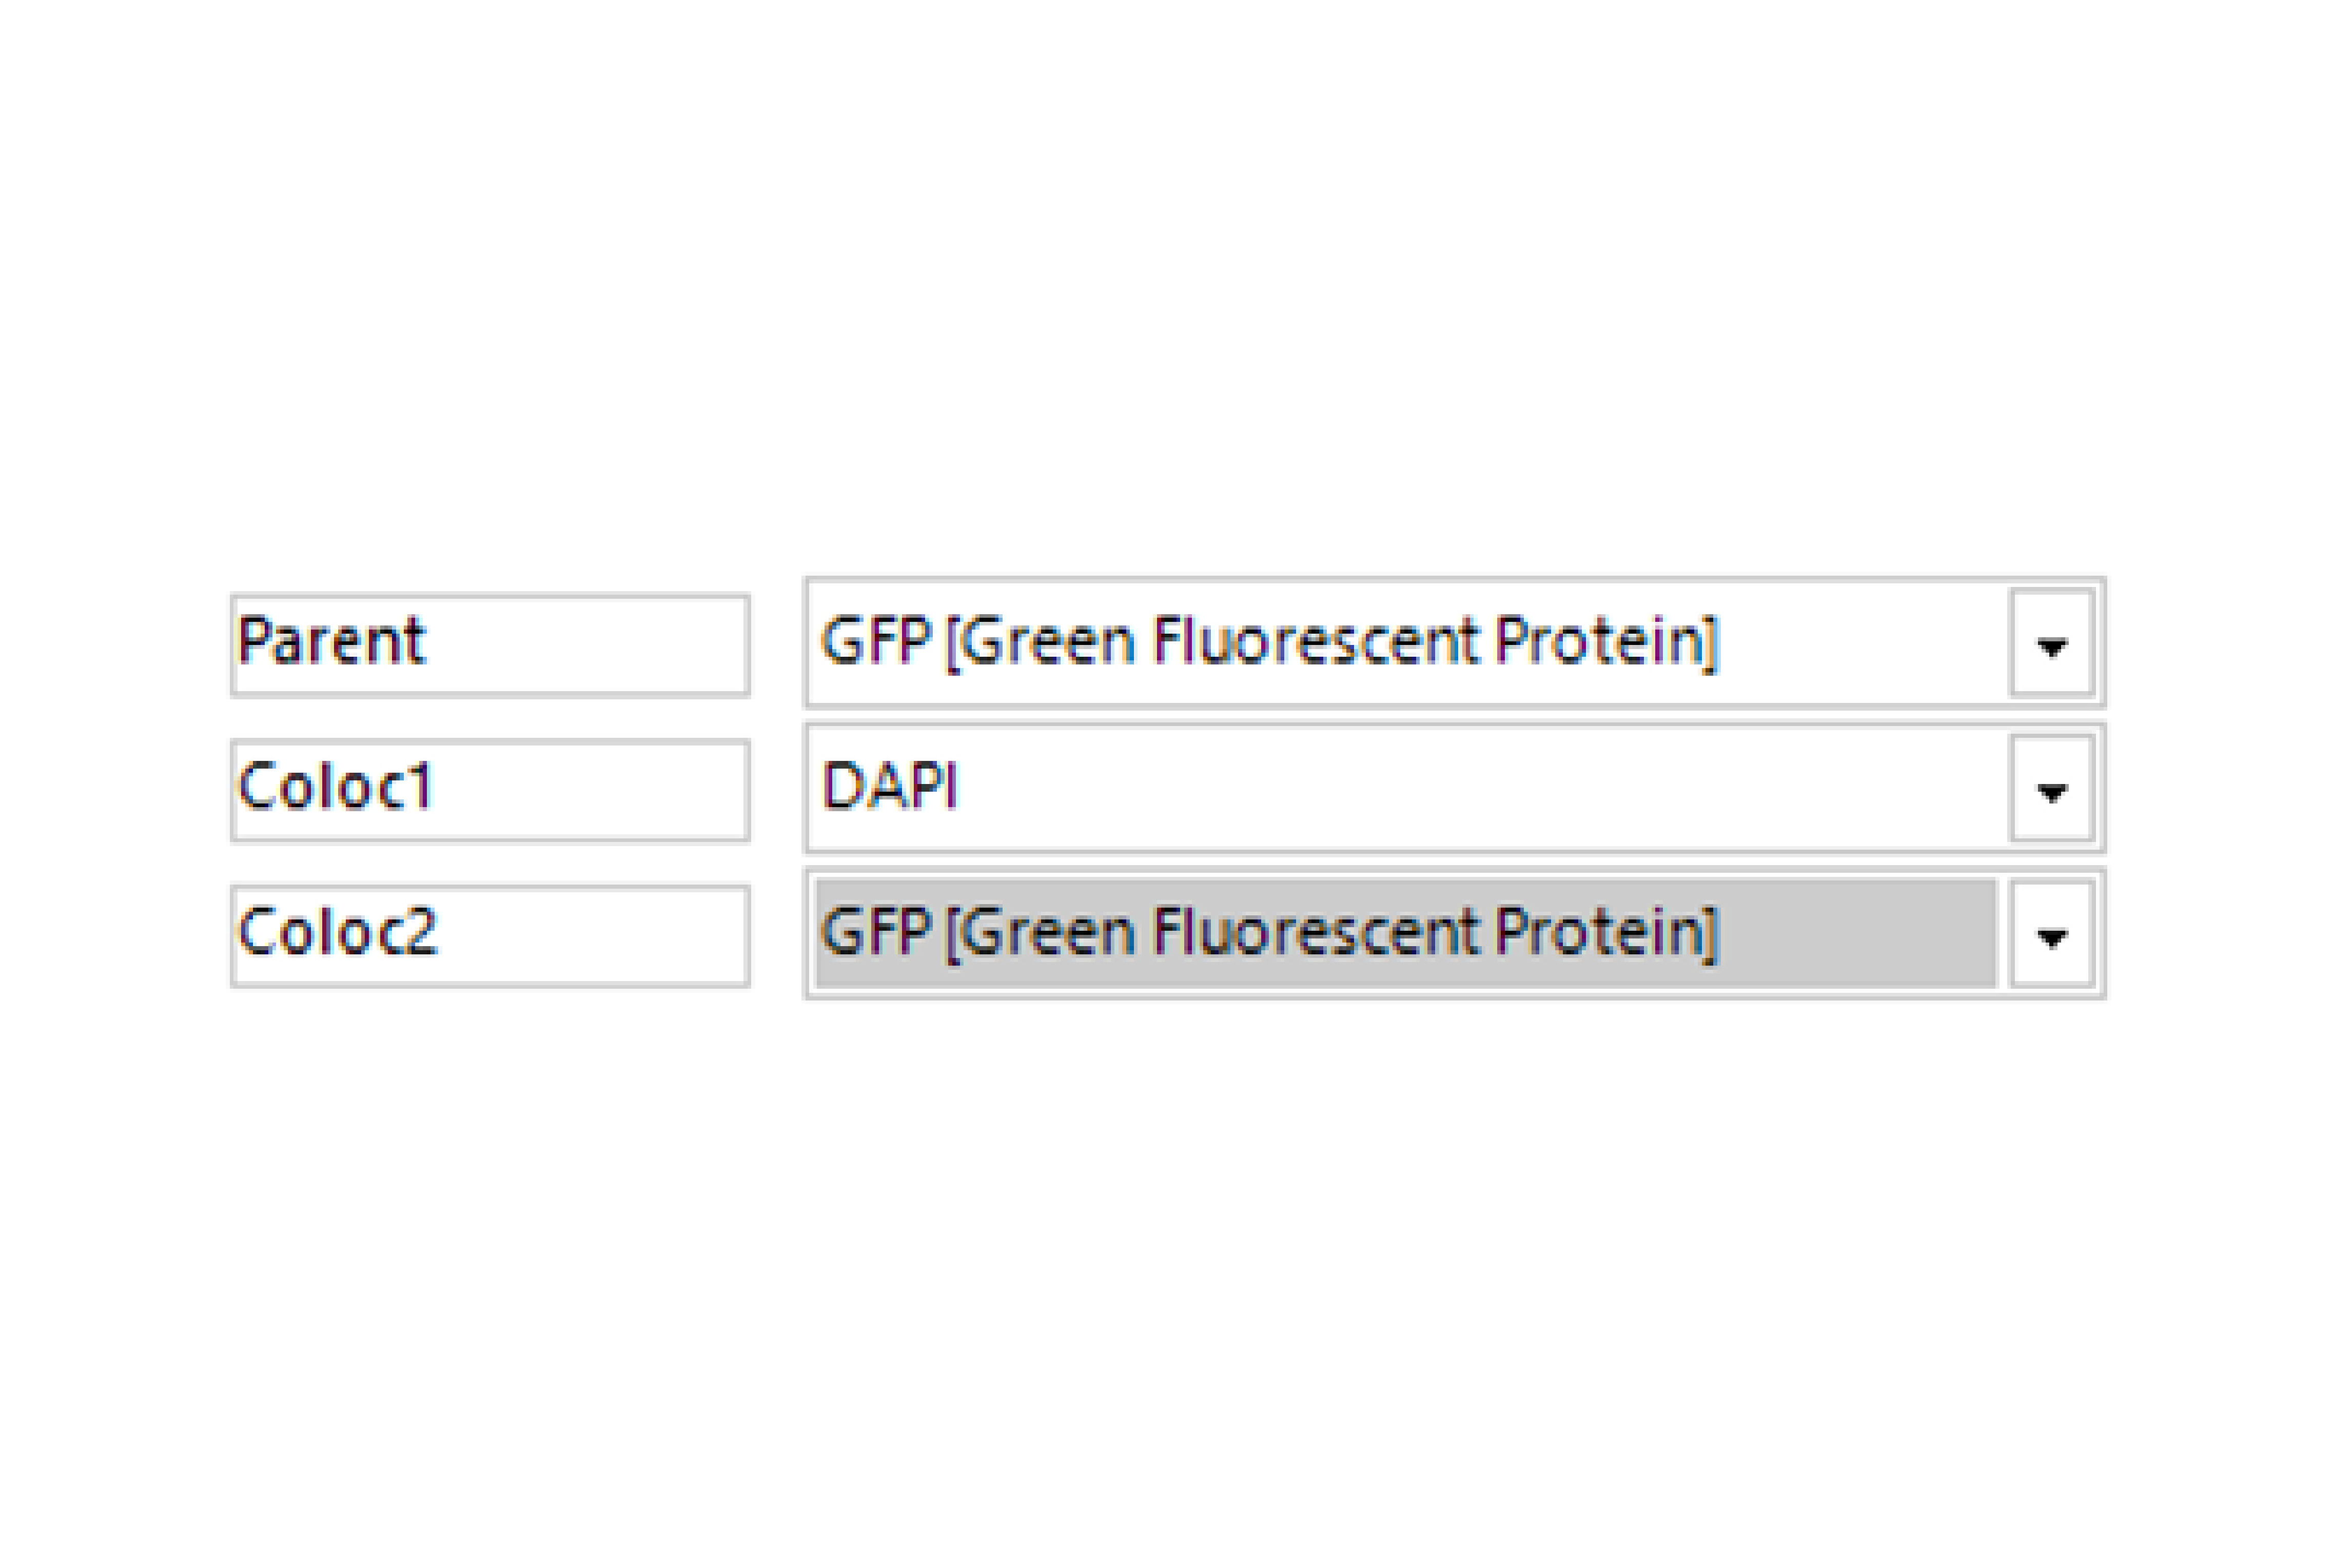
Select Channel
Select the channels that contains labeled parent objects (optional) and the colocalization analysis channels.
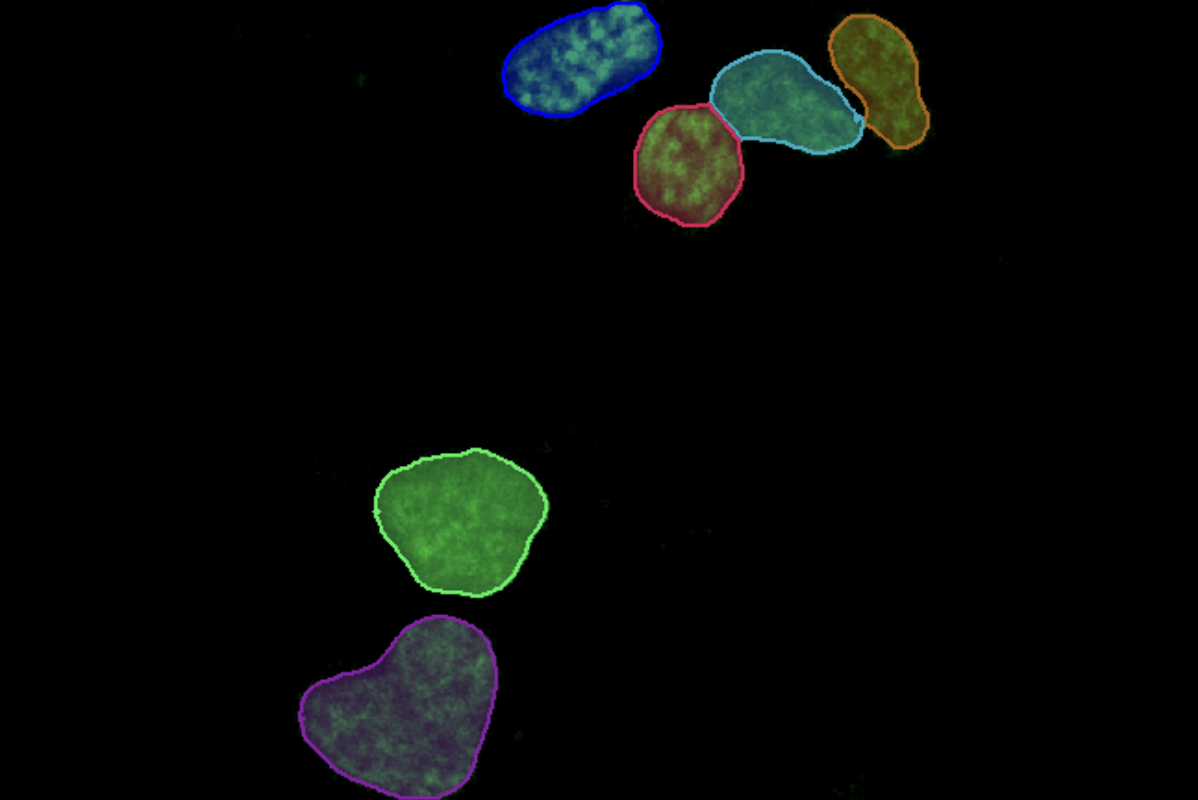
Find Parent Objects
Find parent objects with a pre-trained deep learning model, machine learning, or threshold segmentation.
Calculate Thresholds
Automatically calculate the thresholds for the colocalization analysis channels.
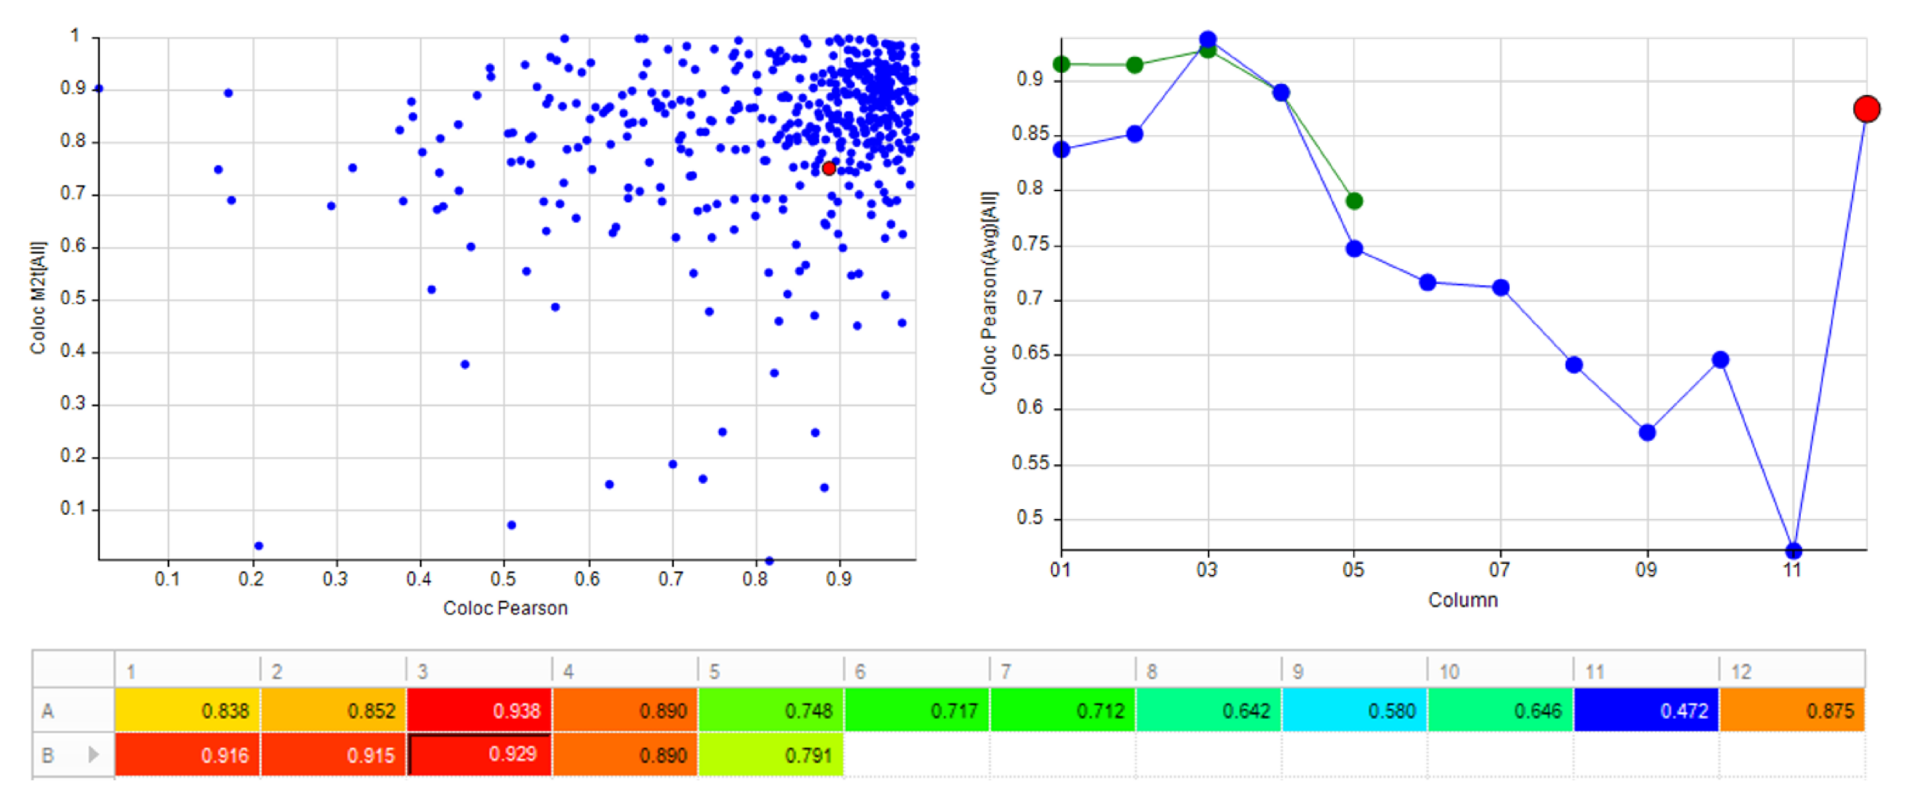
Automatically generate tables, heat maps, charts and even complex bespoke reports.
Measurement parameters supported
Required Modules
Recommended Package
Apps are designed for customers with a registered copy of Media Cybernetics software. Please review the App Center specifications tab to ensure your software is supported. To download the App, please fill out the form below.
Thank you for providing your information.
Please download the App using the link below.
Adding {{itemName}} to cart
Added {{itemName}} to cart